この度E資格を受ける前 E資格を受けるために現在ラビットチャレンジを受講中である。その受講内容をレポートとしてまとめる。
今回は深層学習の仕組みから最新のCNN事情について学んだこと・気づいたことを記す。
深層学習
ディープラーニングの目的は、明示的なプログラムの代わりに多数の中間層をもつニューラルネットワークを用いて、入力値を目的とする出力値に変換する数学モデルを構築することである。
ニューラルネットワークでできること下記のようなことが実施できる。
- 回帰
- 結果予想
- ランキング
- 線形回帰、回帰木、ランダムフォレスト、ニューラルネットワークに活用
- 分類
- 動物写真の判別
- 手書き文字認識
- 花の種類分類
- ベイズ分類、ロジスティック回帰、決定機、ランダムフォレスト、ニューラルネットワークに活用
深層学習の実用例には自動売買、チャットボット、翻訳、音声解釈、囲碁、将棋AIが挙げられる。本レポートではこれらの機能を実現する深層学習に関連する要素を取り上げる。
入力層~中間層
概要
深層学習における入力層は説明変数に重みをかけて中間層にデータを連携する役割を担っている。説明変数入力x_i、重みw_i、バイアスb、総入力u、出力zに重みを付けた数値が活性化関数f通じて総入力uを生成する。数式は下記の通り。
また、中間層では入力層から受け継いだ情報に色々な計算を行い情報を加工する。中間層が多ければ多いほど複雑な分析を実現することができる。
中間層は技術者で数を調整することができ、3層以上から構成されるニューラルネットワークをディープラーニングモデルと呼ぶ。深層学習モデルの利用者からはこの中間層の存在は明示されていないため、隠れ層とも呼ばれる。
$$ u = w_1x_1 + w_2x_2 + w_3x_3 + w_4x_4 = Wx+b $$
総入力u のコードは下記の通り
u = np.dot(W, x) + b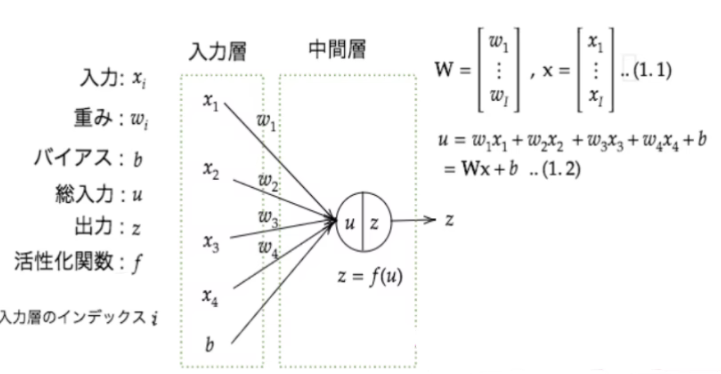
実装(順伝播ー単層・単ユニット)
単層・ 単ユニットのニューラルネットワークの順伝播の結果は下記の通り。
W = np.array([[0.1], [0.2]])

print_vec("重み", W)


b = np.array(0.5)

print_vec("バイアス", b)


x = np.array([6, 9])
print_vec("入力", x)


u = np.dot(x, W) + b
print_vec("総入力", u)


z = functions.relu(u)
print_vec("中間層出力", z)
出力は下記の通り。
*** 重み ***
[[0.1]
 [0.2]]
*** バイアス ***
0.5
*** 入力 ***
[6 9]
*** 総入力 ***
[2.9]
*** 中間層出力 ***
[2.9]
実装(順伝播ー単層・複数ユニット)
単層・複数ユニットのニューラルネットワークの順伝播の結果は下記の通り。
W = np.array([
    [0.1, 0.2, 0.3],
    [0.2, 0.3, 0.4],
    [0.3, 0.4, 0.5],
    [0.4, 0.5, 0.6]
])

print_vec("重み", W)

b = np.array([0.1, 0.2, 0.3])
print_vec("バイアス", b)

x = np.array([1.0, 5.0, 2.0, -1.0])
print_vec("入力", x)

u = np.dot(x, W) + b
print_vec("総入力", u)

z = functions.sigmoid(u)
print_vec("中間層出力", z)
出力は下記の通り。
*** 重み ***
[[0.1 0.2 0.3]
 [0.2 0.3 0.4]
 [0.3 0.4 0.5]
 [0.4 0.5 0.6]]

*** バイアス ***
[0.1 0.2 0.3]

*** 入力 ***
[ 1.  5.  2. -1.]

*** 総入力 ***
[1.4 2.2 3. ]

*** 中間層出力 ***
[0.80218389 0.90024951 0.95257413]
実装(順伝播ー3層・複数ユニット)
3層 ・複数ユニットのニューラルネットワークの順伝播の結果は下記の通り。
def init_network():
    print("##### ネットワークの初期化 #####")
    network = {}

    input_layer_size = 3
    hidden_layer_size_1=10
    hidden_layer_size_2=5
    output_layer_size = 4


    network['W1'] = np.random.rand(input_layer_size, hidden_layer_size_1)
    network['W2'] = np.random.rand(hidden_layer_size_1,hidden_layer_size_2)
    network['W3'] = np.random.rand(hidden_layer_size_2,output_layer_size)

    network['b1'] =  np.random.rand(hidden_layer_size_1)
    network['b2'] =  np.random.rand(hidden_layer_size_2)
    network['b3'] =  np.random.rand(output_layer_size)

    print_vec("重み1", network['W1'] )
    print_vec("重み2", network['W2'] )
    print_vec("重み3", network['W3'] )
    print_vec("バイアス1", network['b1'] )
    print_vec("バイアス2", network['b2'] )
    print_vec("バイアス3", network['b3'] )

    return network

def forward(network, x):

    print("##### 順伝播開始 #####")

    W1, W2, W3 = network['W1'], network['W2'], network['W3']
    b1, b2, b3 = network['b1'], network['b2'], network['b3']

    u1 = np.dot(x, W1) + b1
    z1 = functions.relu(u1)
    u2 = np.dot(z1, W2) + b2
    z2 = functions.relu(u2)
    u3 = np.dot(z2, W3) + b3
    y = u3

    print_vec("総入力1", u1)
    print_vec("中間層出力1", z1)
    print_vec("中間層出力2", z2)
    print_vec("総入力2", u2)
    print_vec("出力", y)
    print("出力合計: " + str(np.sum(y)))

    return y, z1, z2

x = np.array([1., 3., 7.])
print_vec("入力", x)
network =  init_network()
y, z1, z2 = forward(network, x)
出力は下記の通り。
*** 入力 ***
[1. 3. 7.]
##### ネットワークの初期化 #####
*** 重み1 ***
[[0.9116176  0.21895842 0.4615533  0.06427941 0.00912542 0.73770214
  0.43662664 0.88072806 0.29653979 0.46936481]
 [0.59315955 0.09434077 0.97692114 0.24835172 0.41766443 0.34349285
  0.74150756 0.77909854 0.99470281 0.89575251]
 [0.65903924 0.84603411 0.01142454 0.28249118 0.65381476 0.03806466
  0.18146894 0.36427746 0.11651888 0.7430248 ]]
*** 重み2 ***
[[0.40021737 0.15836474 0.36657236 0.23258915 0.22379751]
 [0.31846639 0.97851426 0.20385871 0.92653495 0.45645913]
 [0.53511229 0.91939443 0.35126458 0.02512147 0.1166095 ]
 [0.88173775 0.95779362 0.38930967 0.56574212 0.89496929]
 [0.04618842 0.71924897 0.25134225 0.25517072 0.39541022]
 [0.36360761 0.29493867 0.90104272 0.26523159 0.14156294]
 [0.27272133 0.15334385 0.64474697 0.25312788 0.53400414]
 [0.26326011 0.18896824 0.76053544 0.88479174 0.90269439]
 [0.72514263 0.31931096 0.65406247 0.41984832 0.85750245]
 [0.40662049 0.47033084 0.87388333 0.04242163 0.40436037]]
*** 重み3 ***
[[0.60803199 0.01375554 0.28613769 0.67688601]
 [0.38000043 0.40792498 0.20641575 0.81327312]
 [0.80498718 0.93975164 0.84345549 0.94685373]
 [0.1193854  0.44536666 0.31233802 0.33540064]
 [0.58506059 0.6672424  0.35560601 0.52808571]]
*** バイアス1 ***
[0.68995646 0.51102979 0.71648313 0.30458764 0.91913941 0.16904113
 0.84678688 0.44338285 0.17718624 0.52090313]
*** バイアス2 ***
[0.07620098 0.82625155 0.62067471 0.20345634 0.27771982]
*** バイアス3 ***
[0.81998896 0.27710595 0.16222834 0.40204489]
##### 順伝播開始 #####
*** 総入力1 ***
[7.99432743 6.93524928 4.18877165 3.09136049 6.75796141 2.20367445
 4.77821876 6.21134877 4.2734666  8.87869906]
*** 中間層出力1 ***
[7.99432743 6.93524928 4.18877165 3.09136049 6.75796141 2.20367445
 4.77821876 6.21134877 4.2734666  8.87869906]
*** 中間層出力2 ***
[21.21241461 28.64808449 29.68276885 21.52776699 26.88497756]
*** 総入力2 ***
[21.21241461 28.64808449 29.68276885 21.52776699 26.88497756]
*** 出力 ***
[66.7977902  67.67614066 53.46580954 87.58238835]
出力合計: 275.52212874873663
活性化関数
活性化関数とはニューラルネットワークにおいて次の層への出力の大きさを決める非線形の関数のことを指す。
非線形とは線形な関数が満たす下記2つの条件を満たさない関数のことを指す。
- 加法性:f(x+y)= f(x)+f(y)
- 斉次性:f(kx)=kf(x)
入力値から連携される値によって、次の層への信号のON/OFFや強弱を定める働きをもつ。
中間層用の活性化関数
– ステップ関数
– シグモイド関数
– ReLU関数
ステップ関数
閾値を超えたら発火する関数であり、1か0の値をとる。
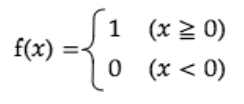
import matplotlib.pyplot as plt

def step_function(x):
    return np.array(x > 0, dtype=np.int)

x = np.arange(-5,5,0.1)
y = step_function(x)

plt.plot(x, y);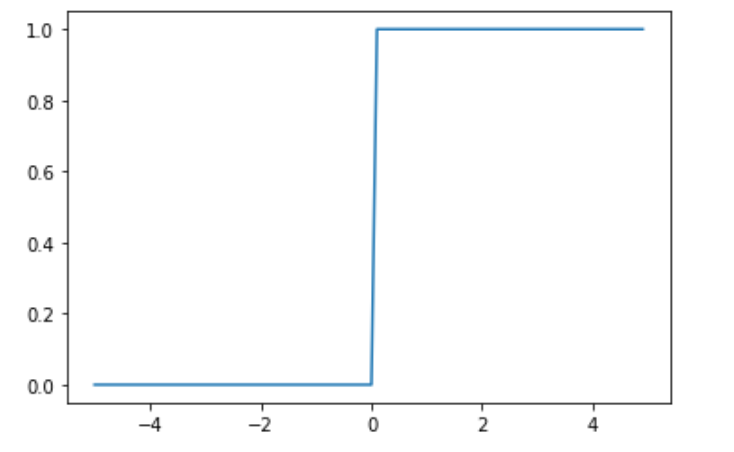
シグモイド関数
ニューラルネットワークでよく用いられる活性化関数。
ステップ関数と比較して滑らかであり、0から1の連続した実数値をとる。
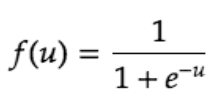
def sigmoid(x):
    return 1 / (1 + np.exp(-x))

x = np.arange(-5,5,0.1)
y = sigmoid(x)

plt.plot(x, y);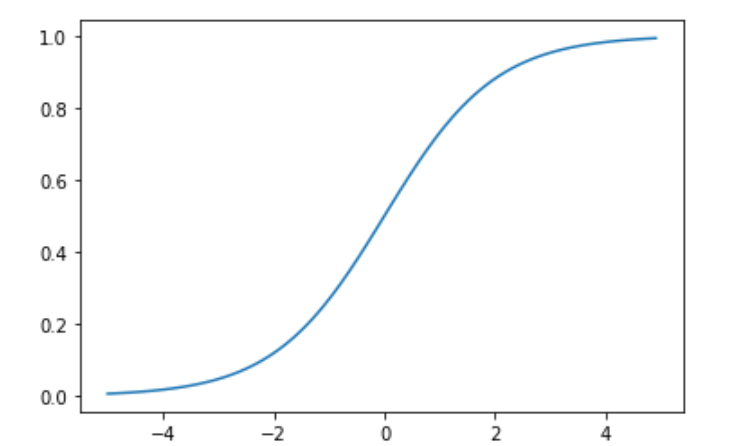
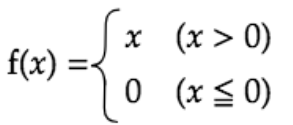
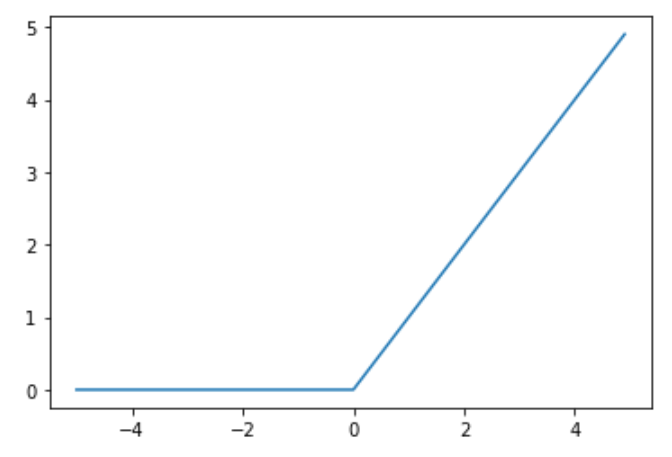
ReLU関数
入力が0を超えていれば、そのまま入力を出力し、0以下ならば0を出力する。
勾配消失問題の回避とスパース化に貢献することで良い結果をもたらしている。
実装 (多クラス分類ー2-3-4ネットワーク)
多クラス分類の実装結果は下記の通り。
def init_network():
    print("##### ネットワークの初期化 #####")


    network = {}

    input_layer_size = 3
    hidden_layer_size=50
    output_layer_size = 6

    network['W1'] = np.random.rand(input_layer_size, hidden_layer_size)
    network['W2'] = np.random.rand(hidden_layer_size,output_layer_size)

    network['b1'] =  np.random.rand(hidden_layer_size)
    network['b2'] =  np.random.rand(output_layer_size)

    print_vec("重み1", network['W1'] )
    print_vec("重み2", network['W2'] )
    print_vec("バイアス1", network['b1'] )
    print_vec("バイアス2", network['b2'] )

    return network


def forward(network, x):

    print("##### 順伝播開始 #####")
    W1, W2 = network['W1'], network['W2']
    b1, b2 = network['b1'], network['b2']

    u1 = np.dot(x, W1) + b1

    z1 = functions.relu(u1)
    u2 = np.dot(z1, W2) + b2
    y = functions.softmax(u2)

    print_vec("総入力1", u1)
    print_vec("中間層出力1", z1)
    print_vec("総入力2", u2)
    print_vec("出力1", y)
    print("出力合計: " + str(np.sum(y)))

    return y, z1

x = np.array([9., 1.,  8.])

d = np.array([0, 0, 0, 1, 0, 0])


network =  init_network()


y, z1 = forward(network, x)
loss = functions.cross_entropy_error(d, y)


print("\n##### 結果表示 #####")
print_vec("出力", y)
print_vec("訓練データ", d)
print_vec("交差エントロピー誤差",  loss)
出力は下記の通り。
def relu(x):
    return np.maximum(0, x)

x = np.arange(-5,5,0.1)
y = relu(x)

plt.plot(x, y);
出力層
誤差
出力の値と訓練データ(答え)との誤差を利用して学習を行う。
例えばこの誤差の計算に二乗誤差を使用する場合は、誤差関数は以下の式となる。
$$ E_n(w) =1/2\sum_{i=1}^f(y_i-d_i)^2 $$
def mean_squared_error(d, y):
    return np.mean(np.square(d - y)) / 2
分類問題の場合はクロスエントロピー誤差、回帰問題の場合は平均二乗誤差を用いる。
ここで、クロスエントロピーは以下の式で定義される誤差関数である。
$$ E_n(w) =-\sum_{i=1}^fd_ilogy_i $$
def cross_entropy_error(d, y):
    if y.ndim == 1:
        d = d.reshape(1, d.size)
        y = y.reshape(1, y.size)
        if d.size == y.size:
        d = d.argmax(axis=1)
    batch_size = y.shape[0]
    return -np.sum(np.log(y[np.arange(batch_size), d] + 1e-7)) / batch_size
活性化関数
中間層では、閾値の前後で信号の強弱を調整するが、出力層では、信号の大きさはそのままに変換する。また、分類問題では出力層の出力は総和が1になる必要がある。
出力層の活性化関数は分析手法によって異なるものが用いられる。
・回帰:恒等写像
・二値分類:シグモイド関数
・多クラス分類:ソフトマックス関数
恒等写像では二乗誤差、シグモイド関数とソフトマックス関数では交差エントロピーを利用している。
実装
ソフトマックス関数を利用した多クラス分類の実装結果は下記の通り。
def init_network():
    print("##### ネットワークの初期化 #####")

    network = {}

    input_layer_size = 3
    hidden_layer_size=50
    output_layer_size = 6

   network['W1'] = np.random.rand(input_layer_size, hidden_layer_size)
    network['W2'] = np.random.rand(hidden_layer_size,output_layer_size)

    network['b1'] =  np.random.rand(hidden_layer_size)
    network['b2'] =  np.random.rand(output_layer_size)

    print_vec("重み1", network['W1'] )
    print_vec("重み2", network['W2'] )
    print_vec("バイアス1", network['b1'] )
    print_vec("バイアス2", network['b2'] )

    return network

def forward(network, x):

    print("##### 順伝播開始 #####")
    W1, W2 = network['W1'], network['W2']
    b1, b2 = network['b1'], network['b2']

    u1 = np.dot(x, W1) + b1
    z1 = functions.relu(u1)
    u2 = np.dot(z1, W2) + b2
    y = functions.softmax(u2)

    print_vec("総入力1", u1)
    print_vec("中間層出力1", z1)
    print_vec("総入力2", u2)
    print_vec("出力1", y)
    print("出力合計: " + str(np.sum(y)))

    return y, z1

x = np.array([9., 1.,  8.])

d = np.array([0, 0, 0, 1, 0, 0])

network =  init_network()

y, z1 = forward(network, x)

loss = functions.cross_entropy_error(d, y)


print("\n##### 結果表示 #####")
print_vec("出力", y)
print_vec("訓練データ", d)
print_vec("交差エントロピー誤差",  loss)
出力結果は下記の通り。
##### ネットワークの初期化 #####
*** 重み1 ***
[[0.52498455 0.06354174 0.24074822 0.21288485 0.99539167 0.3510326
  0.36850049 0.52140998 0.58090809 0.55676465 0.20419459 0.87351038
  0.82280133 0.4976545  0.8943313  0.89789144 0.63639834 0.67664159
  0.83909708 0.70970738 0.97417634 0.04182498 0.1065096  0.32688911
  0.35492876 0.09295498 0.12082556 0.27147744 0.75792513 0.64864083
  0.65005958 0.03904307 0.94449394 0.60390249 0.38651452 0.85074839
  0.83017712 0.2223396  0.16520699 0.03009753 0.1206982  0.55402703
  0.57986598 0.2743315  0.22513088 0.51251204 0.36688414 0.71950746
  0.55096137 0.16932515]
 [0.48016154 0.68560937 0.51741909 0.73981764 0.76158365 0.32337375
  0.79560638 0.70175079 0.31236636 0.30377071 0.82708269 0.55982772
  0.38661613 0.65270489 0.37932481 0.57065346 0.7033503  0.23128721
  0.91496208 0.82191674 0.67741362 0.05794862 0.56628106 0.77688901
  0.48208968 0.23685477 0.36436903 0.37456703 0.86445743 0.82454799
  0.74903969 0.97204615 0.94545653 0.50868528 0.2989813  0.14160767
  0.6380158  0.77910926 0.45432302 0.41725503 0.53534897 0.41853861
  0.58754111 0.48177948 0.24773203 0.50944087 0.62094437 0.99848632
  0.45331601 0.6540147 ]
 [0.59326202 0.28477658 0.6883409  0.59657813 0.96331623 0.97924443
  0.24950456 0.32361995 0.71559151 0.7526639  0.80524807 0.30118897
  0.3467327  0.89148271 0.35566529 0.17001718 0.38946639 0.66739024
  0.83268577 0.96767289 0.26084497 0.15317878 0.24881463 0.19193692
  0.64846554 0.4231539  0.43839127 0.56468345 0.04398369 0.28951109
  0.84389326 0.06342787 0.07448397 0.83234537 0.89865915 0.52282665
  0.28593031 0.65223344 0.52620432 0.69669477 0.73905998 0.29944532
  0.51655648 0.28400728 0.51073159 0.03230265 0.37644447 0.38073666
  0.49464424 0.67743879]]
*** 重み2 ***
[[0.91943931 0.72951122 0.95990727 0.21523501 0.68788986 0.86216518]
 [0.75822443 0.34800001 0.00896301 0.81876336 0.98527754 0.03528615]
 [0.74355367 0.49059116 0.02075963 0.30214323 0.50697615 0.95250732]
 [0.91098534 0.92739143 0.79057706 0.65379193 0.42394981 0.19596156]
 [0.5188294  0.56276236 0.62318595 0.12087782 0.38405216 0.35767374]
 [0.9587103  0.98398952 0.72771725 0.40944182 0.96163012 0.62412728]
 [0.2925117  0.0147799  0.65353856 0.24520336 0.203127   0.41037348]
 [0.34652408 0.88554647 0.63183861 0.40780666 0.71719982 0.46053848]
 [0.74097208 0.75627826 0.88911352 0.80650941 0.95092309 0.61867766]
 [0.84626442 0.52770666 0.43842076 0.7806962  0.06382533 0.69603239]
 [0.81027747 0.43174413 0.58596394 0.10777197 0.29512755 0.07001461]
 [0.15862338 0.6595345  0.76301657 0.7454541  0.08632093 0.43577133]
 [0.98931278 0.22269886 0.03712549 0.56185445 0.14818425 0.945848  ]
 [0.75767553 0.54599886 0.00724531 0.88502914 0.57225048 0.12694058]
 [0.31479432 0.09277687 0.28219039 0.12747724 0.78116676 0.18779754]
 [0.51711204 0.80109581 0.20848541 0.92252799 0.10396665 0.90391993]
 [0.31045236 0.33212771 0.76111637 0.69152429 0.93636973 0.95636504]
 [0.57521235 0.45477352 0.25128916 0.42480286 0.71021211 0.70270626]
 [0.10786042 0.16424711 0.51390975 0.65284574 0.46042641 0.665048  ]
 [0.68542561 0.59394853 0.25482099 0.8412742  0.85468254 0.45542131]
 [0.32384398 0.22214941 0.39278322 0.94957584 0.52809192 0.96634019]
 [0.71967501 0.39671106 0.53219913 0.01508522 0.85418222 0.61324217]
 [0.88437701 0.18571823 0.0554925  0.66460582 0.13988962 0.90705173]
 [0.12470037 0.08681354 0.85017819 0.73037584 0.1273348  0.06386403]
 [0.14719307 0.11670888 0.84556883 0.45354367 0.08026273 0.4150192 ]
 [0.10186304 0.79163713 0.97401844 0.18083431 0.88891586 0.80239553]
 [0.38641838 0.82282351 0.71397567 0.05083307 0.16745401 0.47133214]
 [0.17657883 0.38960517 0.28177481 0.07209682 0.85483074 0.67450029]
 [0.64974175 0.02192782 0.72805471 0.38366668 0.52342235 0.71837288]
 [0.60626898 0.61802452 0.21405607 0.20721712 0.59669183 0.03131809]
 [0.79581919 0.26113313 0.53915015 0.17005548 0.90646868 0.56968554]
 [0.68394934 0.70391238 0.18323761 0.76094101 0.73136035 0.66940253]
 [0.07397002 0.05954602 0.4869979  0.73320801 0.82138226 0.45692237]
 [0.61115363 0.93617124 0.92578423 0.98406765 0.20312199 0.47586249]
 [0.13642741 0.81012612 0.92887898 0.44392368 0.62181697 0.32906879]
 [0.84406033 0.19284836 0.08358031 0.70664446 0.09308835 0.91488381]
 [0.12393945 0.27497125 0.76873001 0.97227682 0.0829445  0.60911393]
 [0.87231822 0.21227751 0.28420865 0.29440869 0.76427601 0.10576623]
 [0.40894815 0.74299787 0.92118246 0.45391009 0.13819423 0.02187599]
 [0.91847707 0.62918441 0.57145444 0.93337877 0.74377878 0.46977827]
 [0.50506236 0.17903007 0.67169385 0.44960987 0.53811486 0.37508008]
 [0.4109595  0.82573744 0.48674337 0.63800949 0.70247601 0.73858457]
 [0.58742574 0.25148918 0.60072896 0.64815589 0.4224252  0.97246145]
 [0.49908399 0.21311301 0.28532084 0.9684701  0.69846485 0.83455455]
 [0.69236798 0.71878925 0.52382439 0.45025142 0.717398   0.52808459]
 [0.46908515 0.64041984 0.43287654 0.36786409 0.86682946 0.43602895]
 [0.95624501 0.3678754  0.30713993 0.76697763 0.46826587 0.54635257]
 [0.37695786 0.25494801 0.86022923 0.8364455  0.54177386 0.95408089]
 [0.98899678 0.46487893 0.94864941 0.66484474 0.93156927 0.74679781]
 [0.72862424 0.14052029 0.62244979 0.24619872 0.12636764 0.92699941]]
*** バイアス1 ***
[0.33898636 0.87342757 0.41521089 0.31400413 0.60481215 0.45994889
 0.06435474 0.12864614 0.53553433 0.6350147  0.36611865 0.40351314
 0.68728739 0.38659977 0.81197817 0.42283692 0.62475112 0.51743866
 0.59757381 0.45226802 0.26065526 0.65574384 0.22002139 0.95004861
 0.80898541 0.70697031 0.8313906  0.27333188 0.38792269 0.16803944
 0.61029782 0.50021151 0.76195293 0.23315561 0.25418172 0.52956177
 0.59065487 0.99537042 0.28353125 0.86222618 0.0286107  0.20185552
 0.04898701 0.4710666  0.56580963 0.03366738 0.09079406 0.91228394
 0.65341102 0.51801716]
*** バイアス2 ***
[0.57540643 0.45932618 0.89711171 0.59230382 0.82737844 0.64078012]
##### 順伝播開始 #####
*** 総入力1 ***
[10.29010509  4.40912525  8.60609113  7.74241049 18.03145065 11.77657154
  6.17250201  8.11204638 11.80080558 11.97097848  9.47293724 11.23444604
 11.25297712 12.65005685 12.08560698 10.43465078 10.17141762 12.17762207
 15.72589579 15.40293431 11.79241575  2.31554756  3.73540587  6.20443496
  9.67315824  5.16565118  5.79031987  7.60866353  8.42557578  9.14644362
 13.96101984  2.33106829 10.80372667 12.83572623 11.22106692 12.51051816
 10.98770723  8.99340365  6.43435171  7.12391721  7.56272326  8.00219992
  9.98777382  5.69388789  6.92557229  5.41413781  7.02525145 11.43223061
 10.02253331  8.11546849]
*** 中間層出力1 ***
[10.29010509  4.40912525  8.60609113  7.74241049 18.03145065 11.77657154
  6.17250201  8.11204638 11.80080558 11.97097848  9.47293724 11.23444604
 11.25297712 12.65005685 12.08560698 10.43465078 10.17141762 12.17762207
 15.72589579 15.40293431 11.79241575  2.31554756  3.73540587  6.20443496
  9.67315824  5.16565118  5.79031987  7.60866353  8.42557578  9.14644362
 13.96101984  2.33106829 10.80372667 12.83572623 11.22106692 12.51051816
 10.98770723  8.99340365  6.43435171  7.12391721  7.56272326  8.00219992
  9.98777382  5.69388789  6.92557229  5.41413781  7.02525145 11.43223061
 10.02253331  8.11546849]
*** 総入力2 ***
[260.69856646 214.82433246 250.46517975 258.45576281 246.55634596
 265.12291599]
*** 出力1 ***
[1.18252653e-02 1.41216097e-22 4.25116060e-07 1.25537548e-03
 8.52948019e-09 9.86918926e-01]
出力合計: 1.0

##### 結果表示 #####
*** 出力 ***
[1.18252653e-02 1.41216097e-22 4.25116060e-07 1.25537548e-03
 8.52948019e-09 9.86918926e-01]
*** 訓練データ ***
[0 0 0 1 0 0]
*** 交差エントロピー誤差 ***
6.680240908239747
勾配降下法
深層学習の目的は学習を通じて誤差を最小にネットワークを作成することである。これはすなわち誤差E(w)を最小化するパラメータwを最適化と同義である。
パラメータの最適化の手法として以下のものがある。
- 勾配降下法
- 確率的勾配降下法
- ミニバッチ勾配降下法
学習率をとしたとき勾配降下法は下記の式で表現する。


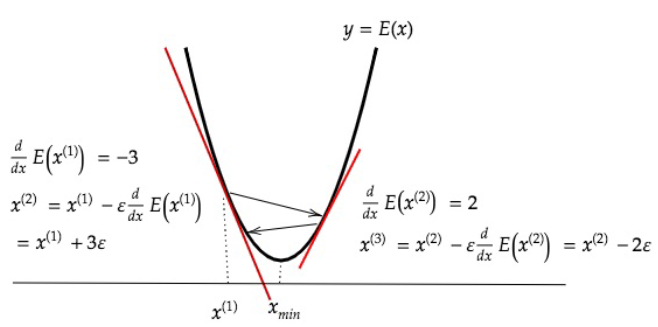
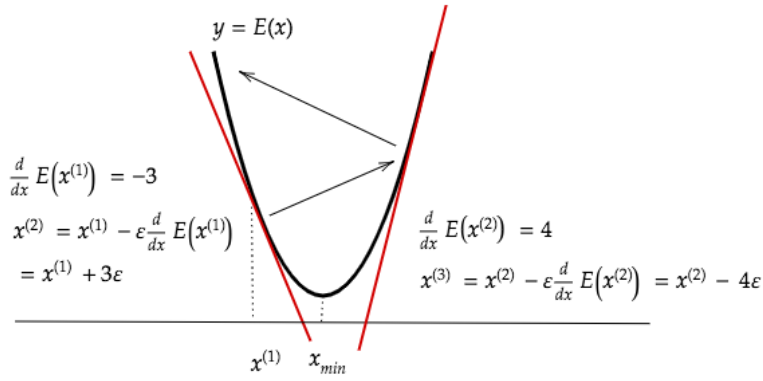
学習率が大きい場合、最小値にいつもでも収束せずに発散してしまう。
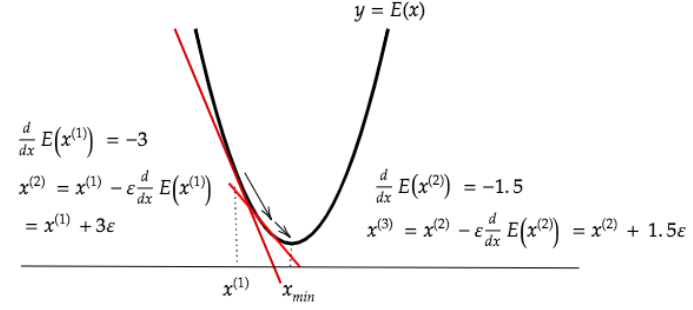
一方、学習率が小さい場合、収束するまでに時間がかかってしまう。
学習率の決定、収束性の精度向上のための以下のようなアルゴリズムが考えられている。
- Momentum
- AdaGrad
- AdaDelta
- Adam
確率的勾配降下法
確率的勾配降下法はデータからランダムに抽出したサンプルの誤差を利用した勾配降下法である。

def __init__(self, learning_rate=0.01):
        self.learning_rate = learning_rate

    def update(self, params, grad):
        for key in params.keys():
            params[key] -= self.learning_rate * grad[key]
確率的勾配降下法のメリットは主に下記3点が挙げられる。
- 計算コストの削減
- 局所解に収束するリスクの軽減
- オンライン学習が可能(データが入ってくるたびに都度パラメータの更新を行う)
ミニバッチ勾配降下法
ミニバッチ勾配降下法とはランダムに抽出したデータの集合D_t(ミニバッチ)に属するサンプルの平均誤差 を利用した勾配降下法である。


ミニバッチ勾配降下法を使うことで計算機の計算資源を有効利用でき、深層学習モデルに頻繁に組み込まれている。
実装
勾配降下法による誤差逆伝播は下記の通り。
def f(x):
    y = 3 * x[0] + 2 * x[1]
    return y

def init_network():
    network = {}
    nodesNum = 10
    network['W1'] = np.random.randn(2, nodesNum)
    network['W2'] = np.random.randn(nodesNum)
    network['b1'] = np.random.randn(nodesNum)
    network['b2'] = np.random.randn()

    return network

def forward(network, x):

    W1, W2 = network['W1'], network['W2']
    b1, b2 = network['b1'], network['b2']
    u1 = np.dot(x, W1) + b1
    z1 = functions.relu(u1)

    u2 = np.dot(z1, W2) + b2
    y = u2

    return z1, y

def backward(x, d, z1, y):

    grad = {}

    W1, W2 = network['W1'], network['W2']
    b1, b2 = network['b1'], network['b2']

    delta2 = functions.d_mean_squared_error(d, y)
    grad['b2'] = np.sum(delta2, axis=0)
    grad['W2'] = np.dot(z1.T, delta2)
    #delta1 = np.dot(delta2, W2.T) * functions.d_relu(z1)

    delta1 = np.dot(delta2, W2.T) * functions.d_sigmoid(z1)

    delta1 = delta1[np.newaxis, :]
    grad['b1'] = np.sum(delta1, axis=0)
    x = x[np.newaxis, :]
    grad['W1'] = np.dot(x.T, delta1)

    return grad

data_sets_size = 100000
data_sets = [0 for i in range(data_sets_size)]

for i in range(data_sets_size):
    data_sets[i] = {}
    data_sets[i]['x'] = np.random.rand(2)
    data_sets[i]['d'] = f(data_sets[i]['x'])

losses = []
learning_rate = 0.07
epoch = 1000

network = init_network()
random_datasets = np.random.choice(data_sets, epoch)

for dataset in random_datasets:
    x, d = dataset['x'], dataset['d']
    z1, y = forward(network, x)
    grad = backward(x, d, z1, y)
    for key in ('W1', 'W2', 'b1', 'b2'):
        network[key]  -= learning_rate * grad[key]
    loss = functions.mean_squared_error(d, y)
    losses.append(loss)

print("##### 結果表示 #####")
lists = range(epoch)


plt.plot(lists, losses, '.')
plt.show()
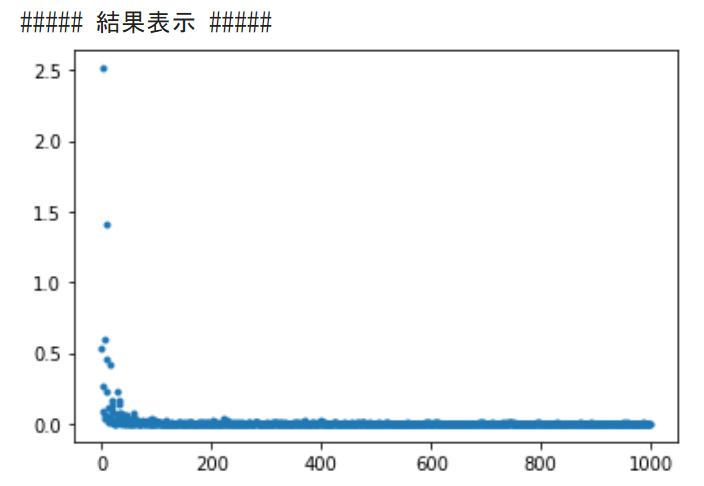
出力結果は下記の通り。縦軸は損失、横軸はエポック数を表示している。
誤差逆伝播法
概要
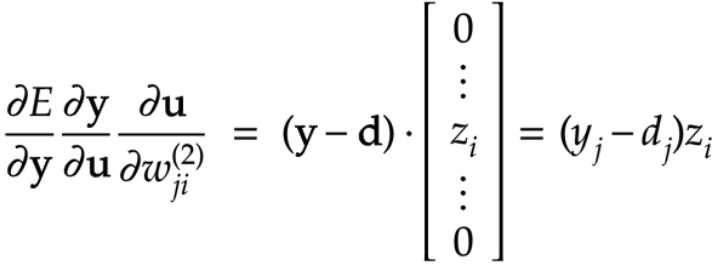
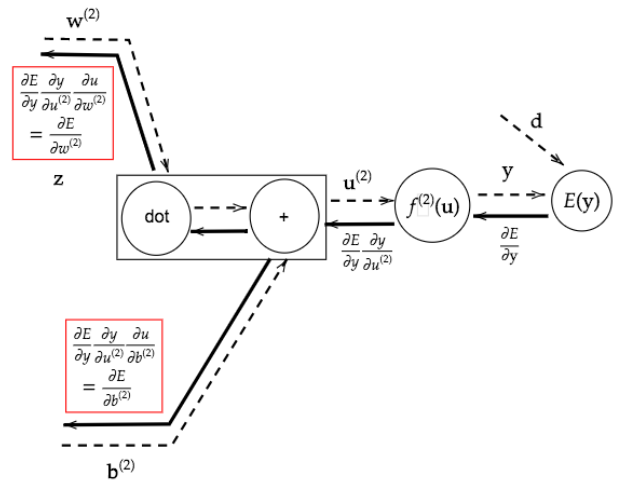
誤差逆伝播法とは算出された誤差を、出力層側から順に微分し、前の層へと伝播させる方法。
出力層で深層学習モデルによって得られた結果を教師データと照合して、出力層から入力層に向けて誤差を修正する。
実装
誤差逆伝播法による実装は下記の通り。
def init_network():
    print("##### ネットワークの初期化 #####")

    network = {}
    network['W1'] = np.array([
        [0.1, 0.3, 0.5],
        [0.2, 0.4, 0.6]
    ])

    network['W2'] = np.array([
        [0.1, 0.4],
        [0.2, 0.5],
        [0.3, 0.6]
    ])

    network['b1'] = np.array([0.1, 0.2, 0.3])
    network['b2'] = np.array([0.1, 0.2])

    print_vec("重み1", network['W1'])
    print_vec("重み2", network['W2'])
    print_vec("バイアス1", network['b1'])
    print_vec("バイアス2", network['b2'])

    return network

def forward(network, x):
    print("##### 順伝播開始 #####")

    W1, W2 = network['W1'], network['W2']
    b1, b2 = network['b1'], network['b2']

    u1 = np.dot(x, W1) + b1
    z1 = functions.relu(u1)
    u2 = np.dot(z1, W2) + b2
    y = functions.softmax(u2)

    print_vec("総入力1", u1)
    print_vec("中間層出力1", z1)
    print_vec("総入力2", u2)
    print_vec("出力1", y)
    print("出力合計: " + str(np.sum(y)))

    return y, z1

def backward(x, d, z1, y):
    print("\n##### 誤差逆伝播開始 #####")

    grad = {}

    W1, W2 = network['W1'], network['W2']
    b1, b2 = network['b1'], network['b2']
    delta2 = functions.d_sigmoid_with_loss(d, y)
    grad['b2'] = np.sum(delta2, axis=0)
    grad['W2'] = np.dot(z1.T, delta2)
    delta1 = np.dot(delta2, W2.T) * functions.d_relu(z1)
    grad['b1'] = np.sum(delta1, axis=0)
    grad['W1'] = np.dot(x.T, delta1)

    print_vec("偏微分_dE/du2", delta2)
    print_vec("偏微分_dE/du2", delta1)

    print_vec("偏微分_重み1", grad["W1"])
    print_vec("偏微分_重み2", grad["W2"])
    print_vec("偏微分_バイアス1", grad["b1"])
    print_vec("偏微分_バイアス2", grad["b2"])

    return grad

x = np.array([[1.0, 5.0]])
d = np.array([[0, 1]])
learning_rate = 0.01
network =  init_network()
y, z1 = forward(network, x)

loss = functions.cross_entropy_error(d, y)

grad = backward(x, d, z1, y)
for key in ('W1', 'W2', 'b1', 'b2'):
    network[key]  -= learning_rate * grad[key]

print("##### 結果表示 #####")


print("##### 更新後パラメータ #####")
print_vec("重み1", network['W1'])
print_vec("重み2", network['W2'])
print_vec("バイアス1", network['b1'])
print_vec("バイアス2", network['b2'])
出力は下記の通り。
##### 順伝播開始 #####
*** 総入力1 ***
[[1.2 2.5 3.8]]

*** 中間層出力1 ***
[[1.2 2.5 3.8]]

*** 総入力2 ***
[[1.86 4.21]]

*** 出力1 ***
[[0.08706577 0.91293423]]

出力合計: 1.0

##### 誤差逆伝播開始 #####
*** 偏微分_dE/du2 ***
[[ 0.08706577 -0.08706577]]

*** 偏微分_dE/du2 ***
[[-0.02611973 -0.02611973 -0.02611973]]

*** 偏微分_重み1 ***
[[-0.02611973 -0.02611973 -0.02611973]
 [-0.13059866 -0.13059866 -0.13059866]]

*** 偏微分_重み2 ***
[[ 0.10447893 -0.10447893]
 [ 0.21766443 -0.21766443]
 [ 0.33084994 -0.33084994]]

*** 偏微分_バイアス1 ***
[-0.02611973 -0.02611973 -0.02611973]

*** 偏微分_バイアス2 ***
[ 0.08706577 -0.08706577]

##### 結果表示 #####
##### 更新後パラメータ #####
*** 重み1 ***
[[0.1002612  0.3002612  0.5002612 ]
 [0.20130599 0.40130599 0.60130599]]

*** 重み2 ***
[[0.09895521 0.40104479]
 [0.19782336 0.50217664]
 [0.2966915  0.6033085 ]]

*** バイアス1 ***
[0.1002612 0.2002612 0.3002612]

*** バイアス2 ***
[0.09912934 0.20087066]
勾配消失問題
概要
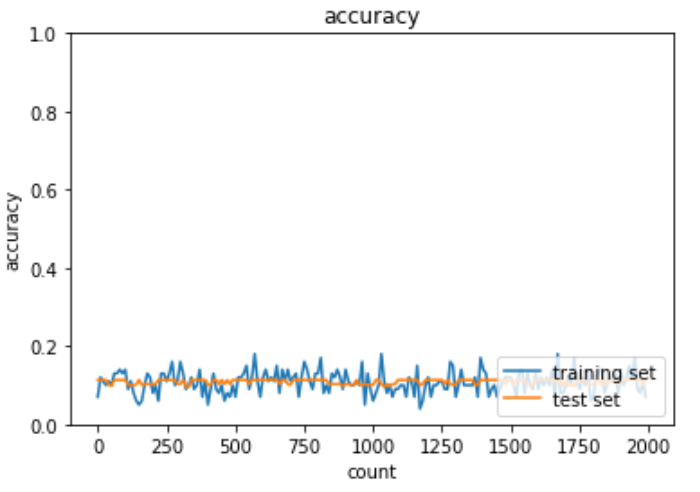
勾配消失問題とは学習が上手く進まなくなる原因の一つ。誤差逆伝播法が下位層に進んでいくにつれて勾配が緩やかになっていく。したがって勾配降下法による行進では下位層のパラメータはあまり変化せず、全体最適解に収束しなくなる。活性化関数として用いられるシグモイド関数では微分の最大値が0.25であるため、勾配消失問題を引き起こす。
実装: 勾配消失問題
実際に深層学習モデルと勾配消失が起きているコードは下記の通り。
import numpy as np
from common import layers
from collections import OrderedDict
from common import functions
from data.mnist import load_mnist
import matplotlib.pyplot as plt

# mnistをロード
(x_train, d_train), (x_test, d_test) = load_mnist(normalize=True, one_hot_label=True)
train_size = len(x_train)

print("データ読み込み完了")

# 重み初期値補正係数
wieght_init = 0.01
#入力層サイズ
input_layer_size = 784
#中間層サイズ
hidden_layer_1_size = 40
hidden_layer_2_size = 20

#出力層サイズ
output_layer_size = 10
# 繰り返し数
iters_num = 2000
# ミニバッチサイズ
batch_size = 100
# 学習率
learning_rate = 0.1
# 描写頻度
plot_interval=10

# 初期設定
def init_network():
    network = {}
    network['W1'] = wieght_init * np.random.randn(input_layer_size, hidden_layer_1_size)
    network['W2'] = wieght_init * np.random.randn(hidden_layer_1_size, hidden_layer_2_size)
    network['W3'] = wieght_init * np.random.randn(hidden_layer_2_size, output_layer_size)

    network['b1'] = np.zeros(hidden_layer_1_size)
    network['b2'] = np.zeros(hidden_layer_2_size)
    network['b3'] = np.zeros(output_layer_size)

    return network

# 順伝播
def forward(network, x):
    W1, W2, W3 = network['W1'], network['W2'], network['W3']
    b1, b2, b3 = network['b1'], network['b2'], network['b3']
    hidden_f = functions.sigmoid

    u1 =  np.dot(x, W1) + b1
    z1 = hidden_f(u1)
    u2 =  np.dot(z1, W2) + b2
    z2 = hidden_f(u2)
    u3 =  np.dot(z2, W3) + b3
    y = functions.softmax(u3)

    return z1, z2, y

# 誤差逆伝播
def backward(x, d, z1, z2, y):
    grad = {}

    W1, W2, W3 = network['W1'], network['W2'], network['W3']
    b1, b2, b3 = network['b1'], network['b2'], network['b3']
    hidden_d_f = functions.d_sigmoid
    last_d_f = functions.d_softmax_with_loss


    # 出力層でのデルタ
    delta3 = last_d_f(d, y)
    # b3の勾配
    grad['b3'] = np.sum(delta3, axis=0)
    # W3の勾配
    grad['W3'] = np.dot(z2.T, delta3)
    # 2層でのデルタ
    delta2 = np.dot(delta3, W3.T) * hidden_d_f(z2)
    # b2の勾配
    grad['b2'] = np.sum(delta2, axis=0)
    # W2の勾配
    grad['W2'] = np.dot(z1.T, delta2)
    # 1層でのデルタ
    delta1 = np.dot(delta2, W2.T) * hidden_d_f(z1)
    # b1の勾配
    grad['b1'] = np.sum(delta1, axis=0)
    # W1の勾配
    grad['W1'] = np.dot(x.T, delta1)

    return grad

# パラメータの初期化
network = init_network()

accuracies_train = []
accuracies_test = []

# 正答率
def accuracy(x, d):
    z1, z2, y = forward(network, x)
    y = np.argmax(y, axis=1)
    if d.ndim != 1 : d = np.argmax(d, axis=1)
    accuracy = np.sum(y == d) / float(x.shape[0])
    return accuracy

for i in range(iters_num):
    # ランダムにバッチを取得
    batch_mask = np.random.choice(train_size, batch_size)
    # ミニバッチに対応する教師訓練画像データを取得
    x_batch = x_train[batch_mask]
    # ミニバッチに対応する訓練正解ラベルデータを取得する
    d_batch = d_train[batch_mask]


    z1, z2, y = forward(network, x_batch)
    grad = backward(x_batch, d_batch, z1, z2, y)

    if (i+1)%plot_interval==0:
        accr_test = accuracy(x_test, d_test)
        accuracies_test.append(accr_test)

        accr_train = accuracy(x_batch, d_batch)
        accuracies_train.append(accr_train)

        print('Generation: ' + str(i+1) + '. 正答率(トレーニング) = ' + str(accr_train))
        print('                : ' + str(i+1) + '. 正答率(テスト) = ' + str(accr_test))

    # パラメータに勾配適用
    for key in ('W1', 'W2', 'W3', 'b1', 'b2', 'b3'):
        network[key]  -= learning_rate * grad[key]


lists = range(0, iters_num, plot_interval)
plt.plot(lists, accuracies_train, label="training set")
plt.plot(lists, accuracies_test,  label="test set")
plt.legend(loc="lower right")
plt.title("accuracy")
plt.xlabel("count")
plt.ylabel("accuracy")
plt.ylim(0, 1.0)
# グラフの表示
plt.show()
出力結果は下記の通り。
勾配消失問題の解決策は主に下記の3つ。
- 活性化関数の選択
- 重みの初期値設定
- バッチ正規化
活性化関数:ReLU関数(再掲)
ソフトマックス関数やtanh関数も勾配焼失問題に役立つものはいくつか存在するが、ここではReLU関数を例に見ていく。
ReLU関数の微分値はx<0では0、x>0ではどの数値でも1になる。したがって不要な係数の重みを排除しつつも必要な係数の重みは残すことが可能。


初期値の設定方法
活性化関数の他にも初期値に特定の加工をすることで、各層を通過した値は0や1に偏ることもなく、活性化関数の表現力を保ったまま勾配消失への対応可能になる。
- Xavier
- 重みの要素を前のノードのルートで標準正規分布を割る処置を実施
- ReLU関数、シグモイド関数、tanh曲線といったS字カーブの関数を使ったデータに適用
- He
- 重みの要素を前のノードのルートで標準正規分布を割って√2掛け合わせた処置を実施
- ReLU関数といったS字カーブでない関数を使ったデータに適用
実装:重み初期化
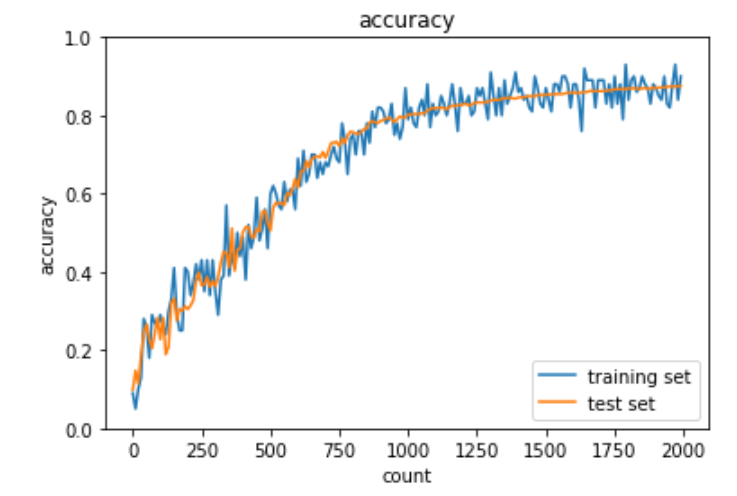
Xavierをシグモイド関数に適用した実装は下記の通り。
# データの読み込み
(x_train, d_train), (x_test, d_test) = load_mnist(normalize=True, one_hot_label=True)

print("データ読み込み完了")

network = MultiLayerNet(input_size=784, hidden_size_list=[40, 20], output_size=10, activation='sigmoid', weight_init_std='Xavier')

iters_num = 2000
train_size = x_train.shape[0]
batch_size = 100
learning_rate = 0.1

train_loss_list = []
accuracies_train = []
accuracies_test = []

plot_interval=10

for i in range(iters_num):
    batch_mask = np.random.choice(train_size, batch_size)
    x_batch = x_train[batch_mask]
    d_batch = d_train[batch_mask]

    # 勾配
    grad = network.gradient(x_batch, d_batch)

    for key in ('W1', 'W2', 'W3', 'b1', 'b2', 'b3'):
        network.params[key] -= learning_rate * grad[key]

    loss = network.loss(x_batch, d_batch)
    train_loss_list.append(loss)

    if (i + 1) % plot_interval == 0:
        accr_test = network.accuracy(x_test, d_test)
        accuracies_test.append(accr_test)
        accr_train = network.accuracy(x_batch, d_batch)
        accuracies_train.append(accr_train)

        print('Generation: ' + str(i+1) + '. 正答率(トレーニング) = ' + str(accr_train))
        print('                : ' + str(i+1) + '. 正答率(テスト) = ' + str(accr_test))


lists = range(0, iters_num, plot_interval)
plt.plot(lists, accuracies_train, label="training set")
plt.plot(lists, accuracies_test,  label="test set")
plt.legend(loc="lower right")
plt.title("accuracy")
plt.xlabel("count")
plt.ylabel("accuracy")
plt.ylim(0, 1.0)
# グラフの表示
plt.show()
出力結果は下記の通り。
HeをReLU関数に適用した実装は下記の通り。
# データの読み込み
(x_train, d_train), (x_test, d_test) = load_mnist(normalize=True, one_hot_label=True)

print("データ読み込み完了")

network = MultiLayerNet(input_size=784, hidden_size_list=[40, 20], output_size=10, activation='relu', weight_init_std='He')

iters_num = 2000
train_size = x_train.shape[0]
batch_size = 100
learning_rate = 0.1

train_loss_list = []
accuracies_train = []
accuracies_test = []

plot_interval=10

for i in range(iters_num):
    batch_mask = np.random.choice(train_size, batch_size)
    x_batch = x_train[batch_mask]
    d_batch = d_train[batch_mask]

    # 勾配
    grad = network.gradient(x_batch, d_batch)

    for key in ('W1', 'W2', 'W3', 'b1', 'b2', 'b3'):
        network.params[key] -= learning_rate * grad[key]

    loss = network.loss(x_batch, d_batch)
    train_loss_list.append(loss)

    if (i + 1) % plot_interval == 0:
        accr_test = network.accuracy(x_test, d_test)
        accuracies_test.append(accr_test)
        accr_train = network.accuracy(x_batch, d_batch)
        accuracies_train.append(accr_train)

        print('Generation: ' + str(i+1) + '. 正答率(トレーニング) = ' + str(accr_train))
        print('                : ' + str(i+1) + '. 正答率(テスト) = ' + str(accr_test))


lists = range(0, iters_num, plot_interval)
plt.plot(lists, accuracies_train, label="training set")
plt.plot(lists, accuracies_test,  label="test set")
plt.legend(loc="lower right")
plt.title("accuracy")
plt.xlabel("count")
plt.ylabel("accuracy")
plt.ylim(0, 1.0)
# グラフの表示
plt.show()
出力結果は下記の通り。
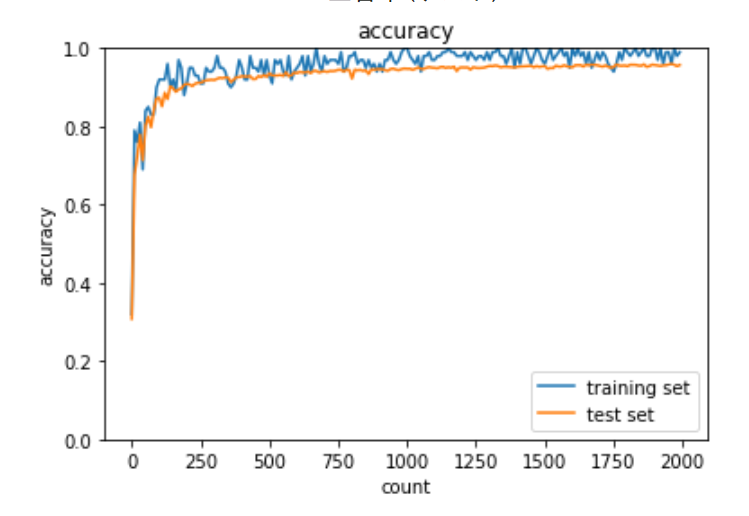
バッチ正規化
バッチ正規化とはミニバッチ単位で入力値のデータの偏りを抑制する方法である。活性化巻数に値を連携する前後にバッチ正規化の処理を含んだ層を加える。
大量の演算処理が求められるため、CPUではなくGPU(MAX画像64枚/バッチ)やTPU(MAX画像256枚/バッチ)を利用する必要がある。
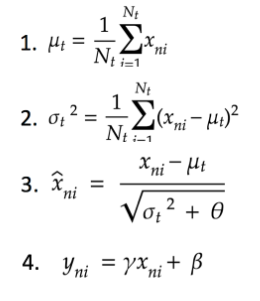
バッチ正規化で行われる演算は大まかに4つ存在する。1.ミニバッチの平均、 2.ミニバッチ の分散、3.ミニバッチの正規化、4.変倍・移動である。
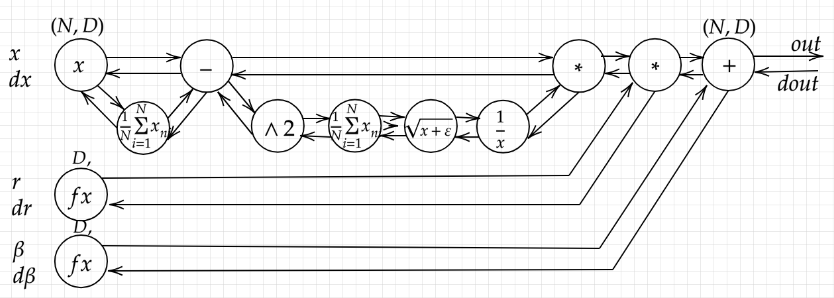
視覚的に捉えたミニバッチのフローは下記のとおりである。
実装:バッチ正規化
バッチ正規化による勾配消失の実装は下記の通り
import numpy as np
from collections import OrderedDict
from common import layers
from data.mnist import load_mnist
import matplotlib.pyplot as plt
from multi_layer_net import MultiLayerNet
from common import optimizer

# バッチ正則化 layer
class BatchNormalization:
    '''
    gamma: スケール係数
    beta: オフセット
    momentum: 慣性
    running_mean: テスト時に使用する平均
    running_var: テスト時に使用する分散
    '''
    def __init__(self, gamma, beta, momentum=0.9, running_mean=None, running_var=None):
        self.gamma = gamma
        self.beta = beta
        self.momentum = momentum
        self.input_shape = None

        self.running_mean = running_mean
        self.running_var = running_var

        # backward時に使用する中間データ
        self.batch_size = None
        self.xc = None
        self.std = None
        self.dgamma = None
        self.dbeta = None

    def forward(self, x, train_flg=True):
        if self.running_mean is None:
            N, D = x.shape
            self.running_mean = np.zeros(D)
            self.running_var = np.zeros(D)

        if train_flg:
            mu = x.mean(axis=0) # 平均
            xc = x - mu # xをセンタリング
            var = np.mean(xc**2, axis=0) # 分散
            std = np.sqrt(var + 10e-7) # スケーリング
            xn = xc / std

            self.batch_size = x.shape[0]
            self.xc = xc
            self.xn = xn
            self.std = std
            self.running_mean = self.momentum * self.running_mean + (1-self.momentum) * mu # 平均値の加重平均
            self.running_var = self.momentum * self.running_var + (1-self.momentum) * var #分散値の加重平均
        else:
            xc = x - self.running_mean
            xn = xc / ((np.sqrt(self.running_var + 10e-7)))

        out = self.gamma * xn + self.beta

        return out

    def backward(self, dout):
        dbeta = dout.sum(axis=0)
        dgamma = np.sum(self.xn * dout, axis=0)
        dxn = self.gamma * dout
        dxc = dxn / self.std
        dstd = -np.sum((dxn * self.xc) / (self.std * self.std), axis=0)
        dvar = 0.5 * dstd / self.std
        dxc += (2.0 / self.batch_size) * self.xc * dvar
        dmu = np.sum(dxc, axis=0)
        dx = dxc - dmu / self.batch_size

        self.dgamma = dgamma
        self.dbeta = dbeta

        return dx
(x_train, d_train), (x_test, d_test) = load_mnist(normalize=True)

print("データ読み込み完了")


# batch_normalizationの設定 =======================
use_batchnorm = True
# use_batchnorm = False
# ====================================================

network = MultiLayerNet(input_size=784, hidden_size_list=[40, 20], output_size=10,
                        activation='sigmoid', weight_init_std='Xavier', use_batchnorm=use_batchnorm)

iters_num = 1000
train_size = x_train.shape[0]
batch_size = 100
learning_rate=0.01

train_loss_list = []
accuracies_train = []
accuracies_test = []

plot_interval=10


for i in range(iters_num):
    batch_mask = np.random.choice(train_size, batch_size)
    x_batch = x_train[batch_mask]
    d_batch = d_train[batch_mask]

    grad = network.gradient(x_batch, d_batch)
    for key in ('W1', 'W2', 'W3', 'b1', 'b2', 'b3'):
        network.params[key] -= learning_rate * grad[key]

        loss = network.loss(x_batch, d_batch)
        train_loss_list.append(loss)

    if (i + 1) % plot_interval == 0:
        accr_test = network.accuracy(x_test, d_test)
        accuracies_test.append(accr_test)
        accr_train = network.accuracy(x_batch, d_batch)
        accuracies_train.append(accr_train)

        print('Generation: ' + str(i+1) + '. 正答率(トレーニング) = ' + str(accr_train))
        print('                : ' + str(i+1) + '. 正答率(テスト) = ' + str(accr_test))


lists = range(0, iters_num, plot_interval)
plt.plot(lists, accuracies_train, label="training set")
plt.plot(lists, accuracies_test,  label="test set")
plt.legend(loc="lower right")
plt.title("accuracy")
plt.xlabel("count")
plt.ylabel("accuracy")
plt.ylim(0, 1.0)
# グラフの表示
plt.show()
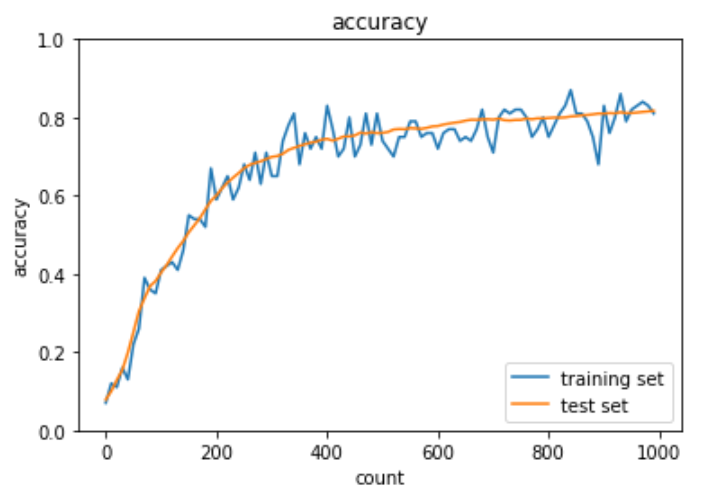
出力結果は下記の通り。エポックを増やしても学習が順調に行われている。
学習率最適化手法
概要
前述のとおり、深層学習では学習を通して誤差を最小とするようなパラメータを発見することが目的となる。その最適化手法として勾配降下法・確率的勾配降下法・ミニバッチ勾配法を学んだが、この項ではより具体的な下記のアルゴリズムを取り上げる。
- Momentum
- AdaGrad
- RMSProp
- Adam
実装:Momentum
Momentumでは誤差をパラメータで微分したものと学習率の積で減算した値をVと置き、Vに現在の重みに前回の重みを減算した値と慣性の積を追加する手法である。

v[key] = momentum * v[key] - learning_rate * grad[key]
params[key] += v[key]学習データに基づくため、最初の内は
Momentumメリットとしては下記2点が挙げられる。
- 大域的最適解となる
- 谷間についてから最適地にいくまでの時間が速い
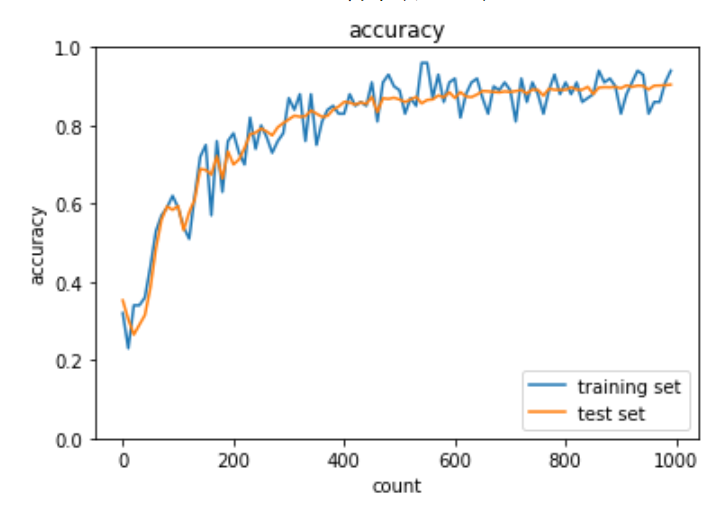
Momentumによる学習率の最適化の実装方法は下記の通り。
# データの読み込み
(x_train, d_train), (x_test, d_test) = load_mnist(normalize=True, one_hot_label=True)

print("データ読み込み完了")

use_batchnorm = True

network = MultiLayerNet(input_size=784, hidden_size_list=[40, 20], output_size=10, activation='sigmoid', weight_init_std=0.01,
                       use_batchnorm=use_batchnorm)

iters_num = 1000
train_size = x_train.shape[0]
batch_size = 100
learning_rate = 0.01
# 慣性
momentum = 0.9

train_loss_list = []
accuracies_train = []
accuracies_test = []

plot_interval=10

for i in range(iters_num):
    batch_mask = np.random.choice(train_size, batch_size)
    x_batch = x_train[batch_mask]
    d_batch = d_train[batch_mask]

    # 勾配
    grad = network.gradient(x_batch, d_batch)
    if i == 0:
        v = {}
    for key in ('W1', 'W2', 'W3', 'b1', 'b2', 'b3'):
        if i == 0:
            v[key] = np.zeros_like(network.params[key])
        v[key] = momentum * v[key] - learning_rate * grad[key]
        network.params[key] += v[key]

        loss = network.loss(x_batch, d_batch)
        train_loss_list.append(loss)

    if (i + 1) % plot_interval == 0:
        accr_test = network.accuracy(x_test, d_test)
        accuracies_test.append(accr_test)
        accr_train = network.accuracy(x_batch, d_batch)
        accuracies_train.append(accr_train)

        print('Generation: ' + str(i+1) + '. 正答率(トレーニング) = ' + str(accr_train))
        print('                : ' + str(i+1) + '. 正答率(テスト) = ' + str(accr_test))


lists = range(0, iters_num, plot_interval)
plt.plot(lists, accuracies_train, label="training set")
plt.plot(lists, accuracies_test,  label="test set")
plt.legend(loc="lower right")
plt.title("accuracy")
plt.xlabel("count")
plt.ylabel("accuracy")
plt.ylim(0, 1.0)
# グラフの表示
plt.show()
出力結果は下記の通り。
実装:AdaGrad
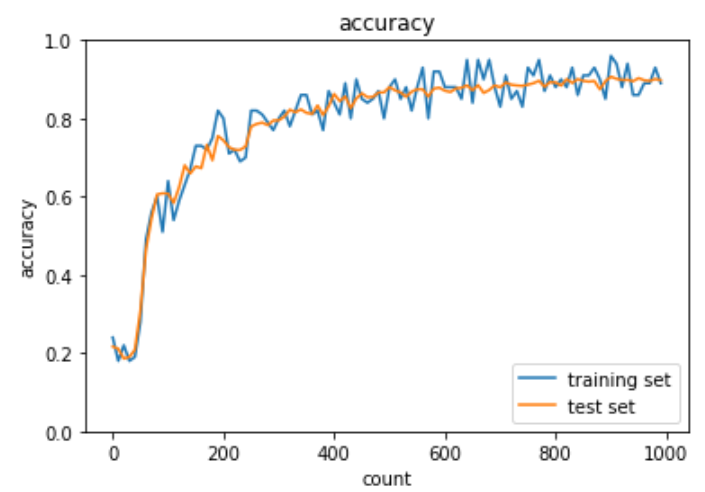
AdaGradは誤差をパラメータで微分したものと再定義した学習率の減産を減産する手法である。最適化の進行方向に加速させて、振動を抑制することで学習の停滞を少なくする。

h[key] = np.zeros_like(val)
self.h[key] += grad[key]*grad[key]
params[key] -= learning_rate * grad[key] / (np.sqrt(h[key]) + 1e-7)AdaGradは勾配の緩やかな斜面に対して最適地に近づけるというメリットがあるが、学習率が徐々に小さくなるため鞍点問題を引き起こすことがある。
最適化対象の関数が鞍のような形になっている部分のことを鞍点という。どの方向に対しても平坦になっており、勾配がゼロに近くなり学習が進まなくなる。鞍点等の停留点に到達して学習が停滞している様をプラトーと呼ぶ。
AdaGradによる学習率の最適化の実装方法は下記の通り。
# データの読み込み
(x_train, d_train), (x_test, d_test) = load_mnist(normalize=True, one_hot_label=True)

print("データ読み込み完了")


use_batchnorm = True


network = MultiLayerNet(input_size=784, hidden_size_list=[40, 20], output_size=10, activation='sigmoid', weight_init_std=0.01,
                       use_batchnorm=use_batchnorm)

iters_num = 1000
# iters_num = 500 # 処理を短縮

train_size = x_train.shape[0]
batch_size = 100
learning_rate = 0.01


train_loss_list = []
accuracies_train = []
accuracies_test = []

plot_interval=10

for i in range(iters_num):
    batch_mask = np.random.choice(train_size, batch_size)
    x_batch = x_train[batch_mask]
    d_batch = d_train[batch_mask]

    # 勾配
    grad = network.gradient(x_batch, d_batch)
    if i == 0:
            h[key] = np.zeros_like(network.params[key])
            h[key] = momentum * h[key] - learning_rate * grad[key]
            network.params[key] += h[key]
    for key in ('W1', 'W2', 'W3', 'b1', 'b2', 'b3'):


        loss = network.loss(x_batch, d_batch)
        train_loss_list.append(loss)

    if (i + 1) % plot_interval == 0:
        accr_test = network.accuracy(x_test, d_test)
        accuracies_test.append(accr_test)
        accr_train = network.accuracy(x_batch, d_batch)
        accuracies_train.append(accr_train)

        print('Generation: ' + str(i+1) + '. 正答率(トレーニング) = ' + str(accr_train))
        print('                : ' + str(i+1) + '. 正答率(テスト) = ' + str(accr_test))


lists = range(0, iters_num, plot_interval)
plt.plot(lists, accuracies_train, label="training set")
plt.plot(lists, accuracies_test,  label="test set")
plt.legend(loc="lower right")
plt.title("accuracy")
plt.xlabel("count")
plt.ylabel("accuracy")
plt.ylim(0, 1.0)
# グラフの表示
plt.show()
出力結果は下記の通り。
実装:RMSProp
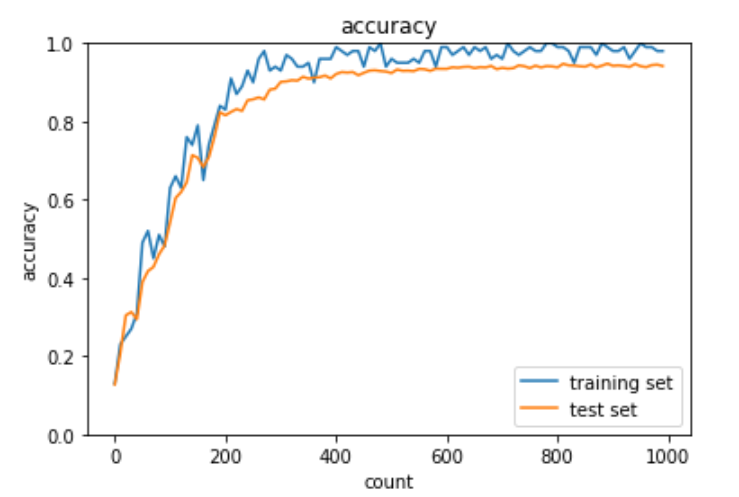
RMSPropはAdaGradを改良し、鞍点問題に対応できるようになったアルゴリズムである。したがって、RMSPropも誤差をパラメータで微分したものと再定義した学習率の減算で最適化が行われる。

self.h[key] *= self.decay_rate
self.h[key] += (1-self.decay_rate)*grad[key]*grad[key]
params[key] -= self.learning_rate * grad[key] / (np.sqrt(h[key]) + 1e-7)RMSPropによる学習率の最適化の実装方法は下記の通り。
# データの読み込み
(x_train, d_train), (x_test, d_test) = load_mnist(normalize=True, one_hot_label=True)

print("データ読み込み完了")


use_batchnorm = True

network = MultiLayerNet(input_size=784, hidden_size_list=[40, 20], output_size=10, activation='sigmoid', weight_init_std=0.01,
                       use_batchnorm=use_batchnorm)

iters_num = 1000
train_size = x_train.shape[0]
batch_size = 100
learning_rate = 0.01
decay_rate = 0.99

train_loss_list = []
accuracies_train = []
accuracies_test = []

plot_interval=10

for i in range(iters_num):
    batch_mask = np.random.choice(train_size, batch_size)
    x_batch = x_train[batch_mask]
    d_batch = d_train[batch_mask]

    # 勾配
    grad = network.gradient(x_batch, d_batch)
    if i == 0:
        h = {}
    for key in ('W1', 'W2', 'W3', 'b1', 'b2', 'b3'):
        if i == 0:
            h[key] = np.zeros_like(network.params[key])
        h[key] *= decay_rate
        h[key] += (1 - decay_rate) * np.square(grad[key])
        network.params[key] -= learning_rate * grad[key] / (np.sqrt(h[key]) + 1e-7)

        loss = network.loss(x_batch, d_batch)
        train_loss_list.append(loss)

    if (i + 1) % plot_interval == 0:
        accr_test = network.accuracy(x_test, d_test)
        accuracies_test.append(accr_test)
        accr_train = network.accuracy(x_batch, d_batch)
        accuracies_train.append(accr_train)

        print('Generation: ' + str(i+1) + '. 正答率(トレーニング) = ' + str(accr_train))
        print('                : ' + str(i+1) + '. 正答率(テスト) = ' + str(accr_test))


lists = range(0, iters_num, plot_interval)
plt.plot(lists, accuracies_train, label="training set")
plt.plot(lists, accuracies_test,  label="test set")
plt.legend(loc="lower right")
plt.title("accuracy")
plt.xlabel("count")
plt.ylabel("accuracy")
plt.ylim(0, 1.0)
# グラフの表示
plt.show()
出力結果は下記の通り。
Adam
Adamは下記の特徴を含んだ最適化アルゴリズム
- Momentumの持つ、過去の勾配の指数関数的減衰平均
- RMSPropの持つ、過去の勾配の2乗の指数関数的減衰平均
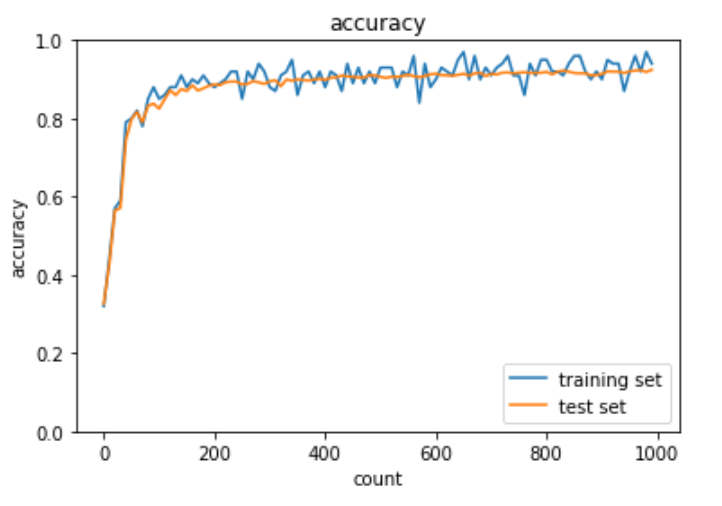
Adamを使うことでMomentumとRMSPropの良いとこ取りをすることができる。
Adamによる学習率の最適化の実装方法は下記の通り。
# データの読み込み
(x_train, d_train), (x_test, d_test) = load_mnist(normalize=True, one_hot_label=True)

print("データ読み込み完了")


use_batchnorm = True

network = MultiLayerNet(input_size=784, hidden_size_list=[40, 20], output_size=10, activation='sigmoid', weight_init_std=0.01,
                       use_batchnorm=use_batchnorm)

iters_num = 1000
train_size = x_train.shape[0]
batch_size = 100
learning_rate = 0.01
beta1 = 0.9
beta2 = 0.999

train_loss_list = []
accuracies_train = []
accuracies_test = []

plot_interval=10

for i in range(iters_num):
    batch_mask = np.random.choice(train_size, batch_size)
    x_batch = x_train[batch_mask]
    d_batch = d_train[batch_mask]

    # 勾配
    grad = network.gradient(x_batch, d_batch)
    if i == 0:
        m = {}
        v = {}
    learning_rate_t  = learning_rate * np.sqrt(1.0 - beta2 ** (i + 1)) / (1.0 - beta1 ** (i + 1))
    for key in ('W1', 'W2', 'W3', 'b1', 'b2', 'b3'):
        if i == 0:
            m[key] = np.zeros_like(network.params[key])
            v[key] = np.zeros_like(network.params[key])

        m[key] += (1 - beta1) * (grad[key] - m[key])
        v[key] += (1 - beta2) * (grad[key] ** 2 - v[key])
        network.params[key] -= learning_rate_t * m[key] / (np.sqrt(v[key]) + 1e-7)


    if (i + 1) % plot_interval == 0:
        accr_test = network.accuracy(x_test, d_test)
        accuracies_test.append(accr_test)
        accr_train = network.accuracy(x_batch, d_batch)
        accuracies_train.append(accr_train)
        loss = network.loss(x_batch, d_batch)
        train_loss_list.append(loss)

        print('Generation: ' + str(i+1) + '. 正答率(トレーニング) = ' + str(accr_train))
        print('                : ' + str(i+1) + '. 正答率(テスト) = ' + str(accr_test))


lists = range(0, iters_num, plot_interval)
plt.plot(lists, accuracies_train, label="training set")
plt.plot(lists, accuracies_test,  label="test set")
plt.legend(loc="lower right")
plt.title("accuracy")
plt.xlabel("count")
plt.ylabel("accuracy")
plt.ylim(0, 1.0)
# グラフの表示
plt.show()
出力結果は下記の通り。
過学習
過学習とは、訓練データの誤差が少なくなっているのに対し、テストデータの誤差が小さくならず、モデルの汎化性能が失われている状態を指す。過学習の原因はパラメータ数が多すぎる等でニューラルネットワークの自由度が大きすぎることが挙げられる。
この項ではニューラルネットワークの自由度を下げることで過学習を抑制する手法について説明する。
荷重減衰
- 過学習の原因
- 重みが大きい
- 学習過程で重みが大きくなりすぎると学習モデルが重要な問題だとご認識することで特定の値に偏った予測が行われる
- 過学習の解決策
- 誤差に正則化項Cを加算することで抑制
L1正則化、L2正則化
- L1正則化(Ridge回帰)
- 正則化項にL2ノルムを使用したもの
- パラメータを0に近づけるするように推定するため縮小推定とも呼ばれる。Lasso回帰よりも過学習の抑止に長けている。
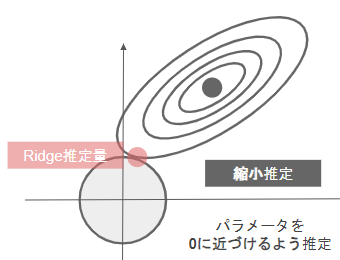
表記 $$ S_\gamma = (y – \phi_w)^T(y – \phi_w) + \gamma ||w||_1 $$
- L2正則化(Lasso回帰)
- 正則化項にL1ノルムを使用したもの
- いくつかのパラメータを正確に0に推定するためスパース推定とも呼ばれる。Ridge回帰よりも不要なパラメータを削ることに長けている。
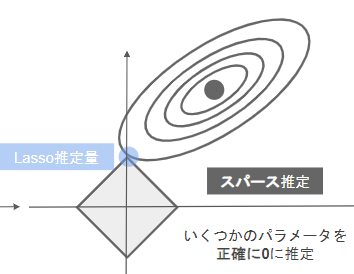
表記 $$ S_\gamma = (y – \phi_w)^T(y – \phi_w) + \gamma ||w||_2 $$
ドロップアウト
ドロップアウトはランダムにノードを削除して学習させることを指す。
ノード数が多いこともニューラルネットワークの自由度を高め、過学習の要因になり得る。そのため、ドロップアウトをすることで毎回異なるモデルを学習させているようにすることでも過学習を抑制が可能。
実装
過学習を起こしているデータ(以下、過学習データ)を用意する。
import numpy as np
from collections import OrderedDict
from common import layers
from data.mnist import load_mnist
import matplotlib.pyplot as plt
from multi_layer_net import MultiLayerNet
from common import optimizer


(x_train, d_train), (x_test, d_test) = load_mnist(normalize=True)

print("データ読み込み完了")

# 過学習を再現するために、学習データを削減
x_train = x_train[:300]
d_train = d_train[:300]

network = MultiLayerNet(input_size=784, hidden_size_list=[100, 100, 100, 100, 100, 100], output_size=10)
optimizer = optimizer.SGD(learning_rate=0.01)

iters_num = 1000
train_size = x_train.shape[0]
batch_size = 100

train_loss_list = []
accuracies_train = []
accuracies_test = []

plot_interval=10


for i in range(iters_num):
    batch_mask = np.random.choice(train_size, batch_size)
    x_batch = x_train[batch_mask]
    d_batch = d_train[batch_mask]

    grad = network.gradient(x_batch, d_batch)
    optimizer.update(network.params, grad)

    loss = network.loss(x_batch, d_batch)
    train_loss_list.append(loss)

    if (i+1) % plot_interval == 0:
        accr_train = network.accuracy(x_train, d_train)
        accr_test = network.accuracy(x_test, d_test)
        accuracies_train.append(accr_train)
        accuracies_test.append(accr_test)

        print('Generation: ' + str(i+1) + '. 正答率(トレーニング) = ' + str(accr_train))
        print('                : ' + str(i+1) + '. 正答率(テスト) = ' + str(accr_test))

lists = range(0, iters_num, plot_interval)
plt.plot(lists, accuracies_train, label="training set")
plt.plot(lists, accuracies_test,  label="test set")
plt.legend(loc="lower right")
plt.title("accuracy")
plt.xlabel("count")
plt.ylabel("accuracy")
plt.ylim(0, 1.0)
# グラフの表示
plt.show()
過学習データのグラフは下記の通り。
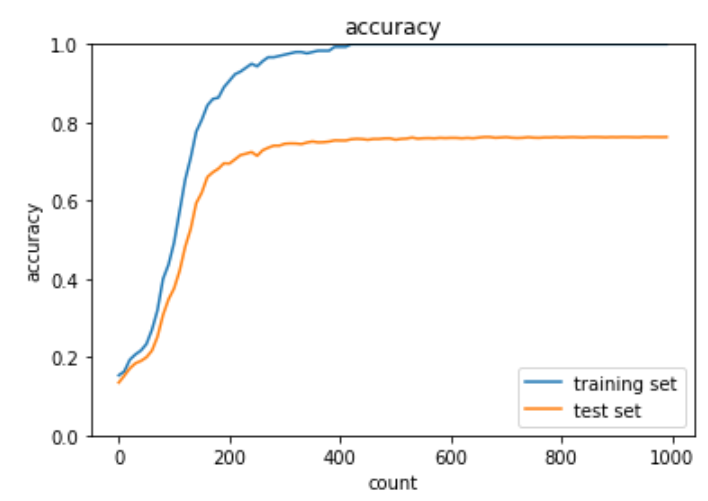
過学習データにL2正則化を実施した実装は下記の通り。
from common import optimizer

(x_train, d_train), (x_test, d_test) = load_mnist(normalize=True)

print("データ読み込み完了")

# 過学習を再現するために、学習データを削減
x_train = x_train[:300]
d_train = d_train[:300]


network = MultiLayerNet(input_size=784, hidden_size_list=[100, 100, 100, 100, 100, 100], output_size=10)


iters_num = 1000
train_size = x_train.shape[0]
batch_size = 100
learning_rate=0.01

train_loss_list = []
accuracies_train = []
accuracies_test = []

plot_interval=10
hidden_layer_num = network.hidden_layer_num

# 正則化強度設定 ======================================
weight_decay_lambda = 0.1
# =================================================

for i in range(iters_num):
    batch_mask = np.random.choice(train_size, batch_size)
    x_batch = x_train[batch_mask]
    d_batch = d_train[batch_mask]

    grad = network.gradient(x_batch, d_batch)
    weight_decay = 0

    for idx in range(1, hidden_layer_num+1):
        grad['W' + str(idx)] = network.layers['Affine' + str(idx)].dW + weight_decay_lambda * network.params['W' + str(idx)]
        grad['b' + str(idx)] = network.layers['Affine' + str(idx)].db
        network.params['W' + str(idx)] -= learning_rate * grad['W' + str(idx)]
        network.params['b' + str(idx)] -= learning_rate * grad['b' + str(idx)]
        weight_decay += 0.5 * weight_decay_lambda * np.sqrt(np.sum(network.params['W' + str(idx)] ** 2))

    loss = network.loss(x_batch, d_batch) + weight_decay
    train_loss_list.append(loss)

    if (i+1) % plot_interval == 0:
        accr_train = network.accuracy(x_train, d_train)
        accr_test = network.accuracy(x_test, d_test)
        accuracies_train.append(accr_train)
        accuracies_test.append(accr_test)

        print('Generation: ' + str(i+1) + '. 正答率(トレーニング) = ' + str(accr_train))
        print('                : ' + str(i+1) + '. 正答率(テスト) = ' + str(accr_test))


lists = range(0, iters_num, plot_interval)
plt.plot(lists, accuracies_train, label="training set")
plt.plot(lists, accuracies_test,  label="test set")
plt.legend(loc="lower right")
plt.title("accuracy")
plt.xlabel("count")
plt.ylabel("accuracy")
plt.ylim(0, 1.0)
# グラフの表示
plt.show()
出力結果は下記の通り。
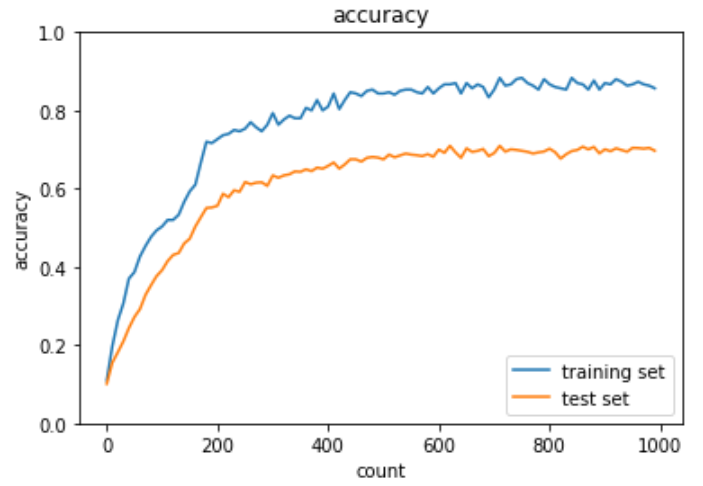
過学習データにL1正則化を実施した実装は下記の通り。
(x_train, d_train), (x_test, d_test) = load_mnist(normalize=True)

print("データ読み込み完了")

# 過学習を再現するために、学習データを削減
x_train = x_train[:300]
d_train = d_train[:300]

network = MultiLayerNet(input_size=784, hidden_size_list=[100, 100, 100, 100, 100, 100], output_size=10)


iters_num = 1000
train_size = x_train.shape[0]
batch_size = 100
learning_rate=0.1

train_loss_list = []
accuracies_train = []
accuracies_test = []

plot_interval=10
hidden_layer_num = network.hidden_layer_num

# 正則化強度設定 ======================================
weight_decay_lambda = 0.005
# =================================================

for i in range(iters_num):
    batch_mask = np.random.choice(train_size, batch_size)
    x_batch = x_train[batch_mask]
    d_batch = d_train[batch_mask]

    grad = network.gradient(x_batch, d_batch)
    weight_decay = 0

    for idx in range(1, hidden_layer_num+1):
        grad['W' + str(idx)] = network.layers['Affine' + str(idx)].dW + weight_decay_lambda * np.sign(network.params['W' + str(idx)])
        grad['b' + str(idx)] = network.layers['Affine' + str(idx)].db
        network.params['W' + str(idx)] -= learning_rate * grad['W' + str(idx)]
        network.params['b' + str(idx)] -= learning_rate * grad['b' + str(idx)]
        weight_decay += weight_decay_lambda * np.sum(np.abs(network.params['W' + str(idx)]))

    loss = network.loss(x_batch, d_batch) + weight_decay
    train_loss_list.append(loss)

    if (i+1) % plot_interval == 0:
        accr_train = network.accuracy(x_train, d_train)
        accr_test = network.accuracy(x_test, d_test)
        accuracies_train.append(accr_train)
        accuracies_test.append(accr_test)

        print('Generation: ' + str(i+1) + '. 正答率(トレーニング) = ' + str(accr_train))
        print('                : ' + str(i+1) + '. 正答率(テスト) = ' + str(accr_test))

lists = range(0, iters_num, plot_interval)
plt.plot(lists, accuracies_train, label="training set")
plt.plot(lists, accuracies_test,  label="test set")
plt.legend(loc="lower right")
plt.title("accuracy")
plt.xlabel("count")
plt.ylabel("accuracy")
plt.ylim(0, 1.0)
# グラフの表示
plt.show()
出力結果は下記の通り。
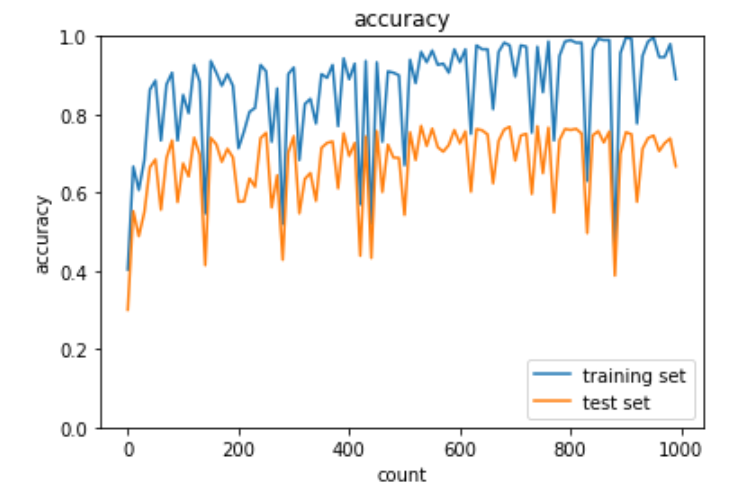
過学習データにドロップアウトを実施した実装は下記の通り。
class Dropout:
    def __init__(self, dropout_ratio=0.5):
        self.dropout_ratio = dropout_ratio
        self.mask = None

    def forward(self, x, train_flg=True):
        if train_flg:
            self.mask = np.random.rand(*x.shape) > self.dropout_ratio
            return x * self.mask
        else:
            return x * (1.0 - self.dropout_ratio)

    def backward(self, dout):
        return dout * self.mask

from common import optimizer
(x_train, d_train), (x_test, d_test) = load_mnist(normalize=True)

print("データ読み込み完了")

# 過学習を再現するために、学習データを削減
x_train = x_train[:300]
d_train = d_train[:300]

# ドロップアウト設定 ======================================
use_dropout = True
dropout_ratio = 0.15
# ====================================================

network = MultiLayerNet(input_size=784, hidden_size_list=[100, 100, 100, 100, 100, 100], output_size=10,
                        weight_decay_lambda=weight_decay_lambda, use_dropout = use_dropout, dropout_ratio = dropout_ratio)
optimizer = optimizer.SGD(learning_rate=0.01)
# optimizer = optimizer.Momentum(learning_rate=0.01, momentum=0.9)
# optimizer = optimizer.AdaGrad(learning_rate=0.01)
# optimizer = optimizer.Adam()

iters_num = 1000
train_size = x_train.shape[0]
batch_size = 100

train_loss_list = []
accuracies_train = []
accuracies_test = []

plot_interval=10


for i in range(iters_num):
    batch_mask = np.random.choice(train_size, batch_size)
    x_batch = x_train[batch_mask]
    d_batch = d_train[batch_mask]

    grad = network.gradient(x_batch, d_batch)
    optimizer.update(network.params, grad)

    loss = network.loss(x_batch, d_batch)
    train_loss_list.append(loss)

    if (i+1) % plot_interval == 0:
        accr_train = network.accuracy(x_train, d_train)
        accr_test = network.accuracy(x_test, d_test)
        accuracies_train.append(accr_train)
        accuracies_test.append(accr_test)

        print('Generation: ' + str(i+1) + '. 正答率(トレーニング) = ' + str(accr_train))
        print('                : ' + str(i+1) + '. 正答率(テスト) = ' + str(accr_test))

lists = range(0, iters_num, plot_interval)
plt.plot(lists, accuracies_train, label="training set")
plt.plot(lists, accuracies_test,  label="test set")
plt.legend(loc="lower right")
plt.title("accuracy")
plt.xlabel("count")
plt.ylabel("accuracy")
plt.ylim(0, 1.0)
# グラフの表示
plt.show()
出力結果は下記の通り。
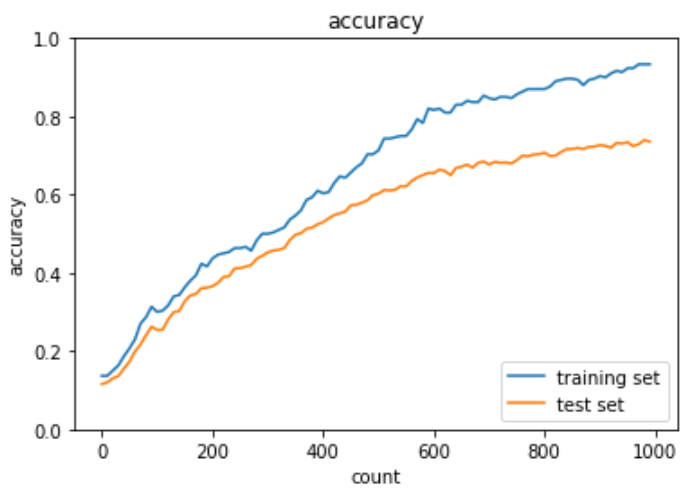
過学習データにドロップアウトとL1正則化を実施した実装は下記の通り。
from common import optimizer
(x_train, d_train), (x_test, d_test) = load_mnist(normalize=True)

print("データ読み込み完了")

# 過学習を再現するために、学習データを削減
x_train = x_train[:300]
d_train = d_train[:300]

# ドロップアウト設定 ======================================
use_dropout = True
dropout_ratio = 0.08
# ====================================================

network = MultiLayerNet(input_size=784, hidden_size_list=[100, 100, 100, 100, 100, 100], output_size=10,
                        use_dropout = use_dropout, dropout_ratio = dropout_ratio)

iters_num = 1000
train_size = x_train.shape[0]
batch_size = 100
learning_rate=0.01

train_loss_list = []
accuracies_train = []
accuracies_test = []
hidden_layer_num = network.hidden_layer_num

plot_interval=10

# 正則化強度設定 ======================================
weight_decay_lambda=0.004
# =================================================

for i in range(iters_num):
    batch_mask = np.random.choice(train_size, batch_size)
    x_batch = x_train[batch_mask]
    d_batch = d_train[batch_mask]

    grad = network.gradient(x_batch, d_batch)
    weight_decay = 0

    for idx in range(1, hidden_layer_num+1):
        grad['W' + str(idx)] = network.layers['Affine' + str(idx)].dW + weight_decay_lambda * np.sign(network.params['W' + str(idx)])
        grad['b' + str(idx)] = network.layers['Affine' + str(idx)].db
        network.params['W' + str(idx)] -= learning_rate * grad['W' + str(idx)]
        network.params['b' + str(idx)] -= learning_rate * grad['b' + str(idx)]
        weight_decay += weight_decay_lambda * np.sum(np.abs(network.params['W' + str(idx)]))

    loss = network.loss(x_batch, d_batch) + weight_decay
    train_loss_list.append(loss)

    if (i+1) % plot_interval == 0:
        accr_train = network.accuracy(x_train, d_train)
        accr_test = network.accuracy(x_test, d_test)
        accuracies_train.append(accr_train)
        accuracies_test.append(accr_test)

        print('Generation: ' + str(i+1) + '. 正答率(トレーニング) = ' + str(accr_train))
        print('                : ' + str(i+1) + '. 正答率(テスト) = ' + str(accr_test))

lists = range(0, iters_num, plot_interval)
plt.plot(lists, accuracies_train, label="training set")
plt.plot(lists, accuracies_test,  label="test set")
plt.legend(loc="lower right")
plt.title("accuracy")
plt.xlabel("count")
plt.ylabel("accuracy")
plt.ylim(0, 1.0)
# グラフの表示
plt.show()
出力結果は下記の通り。
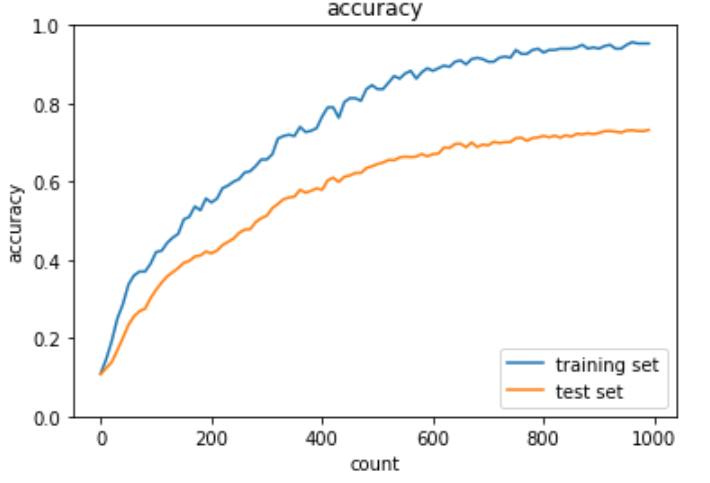
畳み込みニューラルネットワークの概念
畳み込みニューラルネットワーク(CNN)とは主に画像認識に用いられるニューラルネットワークであるが、音声認識等の時系列データにも利用されている。主に畳み込み層とプーリング層と全結合層から構成されている。
全体像
本項ではCNNの代表例としてLeNetを使用する。
LeNetは32×32(=1,024個)の画像データを人間にとって認知可能な10種類の出力データに変換する。大まかな流れは下記の通り。
- C1層は畳み込み演算を使い32×32(=1,024個)のデータを28×28×6(4,704個)のデータに増幅
- S2層はサブサンプリングを使い28×28×6(4,704個)のデータを14×14×6(1,176個)のデータに圧縮
- C3層は畳み込み演算を使い14×14×6(1,176個)のデータを10×10×16(1,600個)のデータに増幅
- S4層はサブサンプリングを使い10×10×16(1,600個)ののデータを5×5×16(400個)のデータに圧縮
- C5層は5×5×16(400個)のデータを120個のデータに圧縮
- F6層は120個のデータを84個のデータに圧縮
- 全結合層で84個のデータを10個のデータに変換

実装
import pickle
import numpy as np
from collections import OrderedDict
from common import layers
from common import optimizer
from data.mnist import load_mnist
import matplotlib.pyplot as plt

# 画像データを2次元配列に変換
'''
input_data: 入力値
filter_h: フィルターの高さ
filter_w: フィルターの横幅
stride: ストライド
pad: パディング
'''
def im2col(input_data, filter_h, filter_w, stride=1, pad=0):
    # N: number, C: channel, H: height, W: width
    N, C, H, W = input_data.shape
    # 切り捨て除算
    out_h = (H + 2 * pad - filter_h)//stride + 1
    out_w = (W + 2 * pad - filter_w)//stride + 1

    img = np.pad(input_data, [(0,0), (0,0), (pad, pad), (pad, pad)], 'constant')
    col = np.zeros((N, C, filter_h, filter_w, out_h, out_w))

    for y in range(filter_h):
        y_max = y + stride * out_h
        for x in range(filter_w):
            x_max = x + stride * out_w
            col[:, :, y, x, :, :] = img[:, :, y:y_max:stride, x:x_max:stride]

    col = col.transpose(0, 4, 5, 1, 2, 3) # (N, C, filter_h, filter_w, out_h, out_w) -> (N, filter_w, out_h, out_w, C, filter_h)

    col = col.reshape(N * out_h * out_w, -1)
    return col

# 2次元配列を画像データに変換
def col2im(col, input_shape, filter_h, filter_w, stride=1, pad=0):
    # N: number, C: channel, H: height, W: width
    N, C, H, W = input_shape
    # 切り捨て除算
    out_h = (H + 2 * pad - filter_h)//stride + 1
    out_w = (W + 2 * pad - filter_w)//stride + 1
    col = col.reshape(N, out_h, out_w, C, filter_h, filter_w).transpose(0, 3, 4, 5, 1, 2) # (N, filter_h, filter_w, out_h, out_w, C)

    img = np.zeros((N, C, H + 2 * pad + stride - 1, W + 2 * pad + stride - 1))
    for y in range(filter_h):
        y_max = y + stride * out_h
        for x in range(filter_w):
            x_max = x + stride * out_w
            img[:, :, y:y_max:stride, x:x_max:stride] += col[:, :, y, x, :, :]

    return img[:, :, pad:H + pad, pad:W + pad]

class Convolution:
    # W: フィルター, b: バイアス
    def __init__(self, W, b, stride=1, pad=0):
        self.W = W
        self.b = b
        self.stride = stride
        self.pad = pad

        # 中間データ(backward時に使用)
        self.x = None
        self.col = None
        self.col_W = None

        # フィルター・バイアスパラメータの勾配
        self.dW = None
        self.db = None

    def forward(self, x):
        # FN: filter_number, C: channel, FH: filter_height, FW: filter_width
        FN, C, FH, FW = self.W.shape
        N, C, H, W = x.shape
        # 出力値のheight, width
        out_h = 1 + int((H + 2 * self.pad - FH) / self.stride)
        out_w = 1 + int((W + 2 * self.pad - FW) / self.stride)

        # xを行列に変換
        col = im2col(x, FH, FW, self.stride, self.pad)
        # フィルターをxに合わせた行列に変換
        col_W = self.W.reshape(FN, -1).T


        out = np.dot(col, col_W) + self.b
        # 計算のために変えた形式を戻す
        out = out.reshape(N, out_h, out_w, -1).transpose(0, 3, 1, 2)

        self.x = x
        self.col = col
        self.col_W = col_W

        return out

    def backward(self, dout):
        FN, C, FH, FW = self.W.shape
        dout = dout.transpose(0, 2, 3, 1).reshape(-1, FN)

        self.db = np.sum(dout, axis=0)
        self.dW = np.dot(self.col.T, dout)
        self.dW = self.dW.transpose(1, 0).reshape(FN, C, FH, FW)

        dcol = np.dot(dout, self.col_W.T)
        # dcolを画像データに変換
        dx = col2im(dcol, self.x.shape, FH, FW, self.stride, self.pad)

        return dx

class Pooling:
    def __init__(self, pool_h, pool_w, stride=1, pad=0):
        self.pool_h = pool_h
        self.pool_w = pool_w
        self.stride = stride
        self.pad = pad

        self.x = None
        self.arg_max = None

    def forward(self, x):
        N, C, H, W = x.shape
        out_h = int(1 + (H - self.pool_h) / self.stride)
        out_w = int(1 + (W - self.pool_w) / self.stride)

        # xを行列に変換
        col = im2col(x, self.pool_h, self.pool_w, self.stride, self.pad)
        # プーリングのサイズに合わせてリサイズ
        col = col.reshape(-1, self.pool_h*self.pool_w)

        #maxプーリング
        arg_max = np.argmax(col, axis=1)
        out = np.max(col, axis=1)
        out = out.reshape(N, out_h, out_w, C).transpose(0, 3, 1, 2)

        self.x = x
        self.arg_max = arg_max

        return out

    def backward(self, dout):
        dout = dout.transpose(0, 2, 3, 1)

        pool_size = self.pool_h * self.pool_w
        dmax = np.zeros((dout.size, pool_size))
        dmax[np.arange(self.arg_max.size), self.arg_max.flatten()] = dout.flatten()
        dmax = dmax.reshape(dout.shape + (pool_size,))

        dcol = dmax.reshape(dmax.shape[0] * dmax.shape[1] * dmax.shape[2], -1)
        dx = col2im(dcol, self.x.shape, self.pool_h, self.pool_w, self.stride, self.pad)

        return dx

class SimpleConvNet:
    # conv - relu - pool - affine - relu - affine - softmax
    def __init__(self, input_dim=(1, 28, 28), conv_param={'filter_num':30, 'filter_size':5, 'pad':0, 'stride':1},
                 hidden_size=100, output_size=10, weight_init_std=0.01):
        filter_num = conv_param['filter_num']
        filter_size = conv_param['filter_size']
        filter_pad = conv_param['pad']
        filter_stride = conv_param['stride']
        input_size = input_dim[1]
        conv_output_size = (input_size - filter_size + 2 * filter_pad) / filter_stride + 1
        pool_output_size = int(filter_num * (conv_output_size / 2) * (conv_output_size / 2))

        # 重みの初期化
        self.params = {}
        self.params['W1'] = weight_init_std * np.random.randn(filter_num, input_dim[0], filter_size, filter_size)
        self.params['b1'] = np.zeros(filter_num)
        self.params['W2'] = weight_init_std * np.random.randn(pool_output_size, hidden_size)
        self.params['b2'] = np.zeros(hidden_size)
        self.params['W3'] = weight_init_std * np.random.randn(hidden_size, output_size)
        self.params['b3'] = np.zeros(output_size)

        # レイヤの生成
        self.layers = OrderedDict()
        self.layers['Conv1'] = layers.Convolution(self.params['W1'], self.params['b1'], conv_param['stride'], conv_param['pad'])
        self.layers['Relu1'] = layers.Relu()
        self.layers['Pool1'] = layers.Pooling(pool_h=2, pool_w=2, stride=2)
        self.layers['Affine1'] = layers.Affine(self.params['W2'], self.params['b2'])
        self.layers['Relu2'] = layers.Relu()
        self.layers['Affine2'] = layers.Affine(self.params['W3'], self.params['b3'])

        self.last_layer = layers.SoftmaxWithLoss()

    def predict(self, x):
        for key in self.layers.keys():
            x = self.layers[key].forward(x)
        return x

    def loss(self, x, d):
        y = self.predict(x)
        return self.last_layer.forward(y, d)

    def accuracy(self, x, d, batch_size=100):
        if d.ndim != 1 : d = np.argmax(d, axis=1)

        acc = 0.0

        for i in range(int(x.shape[0] / batch_size)):
            tx = x[i*batch_size:(i+1)*batch_size]
            td = d[i*batch_size:(i+1)*batch_size]
            y = self.predict(tx)
            y = np.argmax(y, axis=1)
            acc += np.sum(y == td)

        return acc / x.shape[0]

    def gradient(self, x, d):
        # forward
        self.loss(x, d)

        # backward
        dout = 1
        dout = self.last_layer.backward(dout)
        layers = list(self.layers.values())

        layers.reverse()
        for layer in layers:
            dout = layer.backward(dout)

        # 設定
        grad = {}
        grad['W1'], grad['b1'] = self.layers['Conv1'].dW, self.layers['Conv1'].db
        grad['W2'], grad['b2'] = self.layers['Affine1'].dW, self.layers['Affine1'].db
        grad['W3'], grad['b3'] = self.layers['Affine2'].dW, self.layers['Affine2'].db

        return grad

from common import optimizer

# データの読み込み
(x_train, d_train), (x_test, d_test) = load_mnist(flatten=False)

print("データ読み込み完了")

# 処理に時間のかかる場合はデータを削減
x_train, d_train = x_train[:5000], d_train[:5000]
x_test, d_test = x_test[:1000], d_test[:1000]


network = SimpleConvNet(input_dim=(1,28,28), conv_param = {'filter_num': 30, 'filter_size': 5, 'pad': 0, 'stride': 1},
                        hidden_size=100, output_size=10, weight_init_std=0.01)

optimizer = optimizer.Adam()

iters_num = 1000
train_size = x_train.shape[0]
batch_size = 100

train_loss_list = []
accuracies_train = []
accuracies_test = []

plot_interval=10

for i in range(iters_num):
    batch_mask = np.random.choice(train_size, batch_size)
    x_batch = x_train[batch_mask]
    d_batch = d_train[batch_mask]

    grad = network.gradient(x_batch, d_batch)
    optimizer.update(network.params, grad)

    loss = network.loss(x_batch, d_batch)
    train_loss_list.append(loss)

    if (i+1) % plot_interval == 0:
        accr_train = network.accuracy(x_train, d_train)
        accr_test = network.accuracy(x_test, d_test)
        accuracies_train.append(accr_train)
        accuracies_test.append(accr_test)

        print('Generation: ' + str(i+1) + '. 正答率(トレーニング) = ' + str(accr_train))
        print('                : ' + str(i+1) + '. 正答率(テスト) = ' + str(accr_test))

lists = range(0, iters_num, plot_interval)
plt.plot(lists, accuracies_train, label="training set")
plt.plot(lists, accuracies_test,  label="test set")
plt.legend(loc="lower right")
plt.title("accuracy")
plt.xlabel("count")
plt.ylabel("accuracy")
plt.ylim(0, 1.0)
# グラフの表示
plt.show()
出力結果は下記の通り。
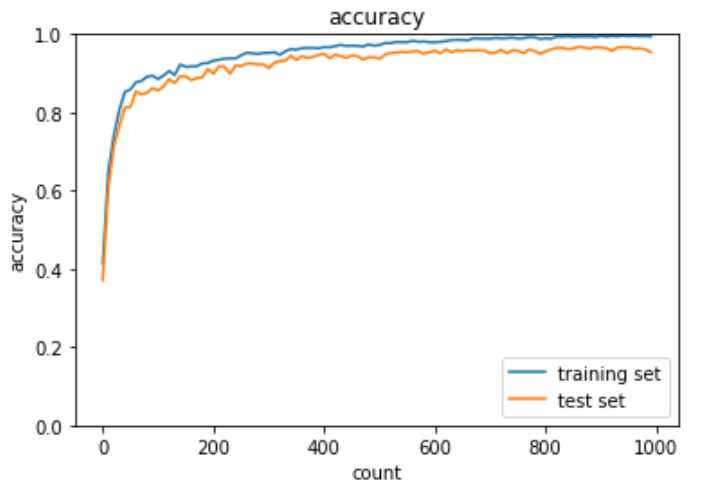
最新のCNN
AlexNet
ILSVRC2012にトロント大のHinton教授のチームによって発表された物体認識に初めてニューラルネットワークを適用した深層学習モデル。ILSVRC2012で優勝を果たしたことにより、ディープラーニングによる特徴量の自動抽出が世界の脚光を浴びた。
AlexNetは畳み込み層及びプーリング層が5層が組み込まれており、全結合層は3層で構成されている。過学習を防ぐ施策としてサイズ4096の全結合層の出力にドロップアウトが使用されている。

コメント